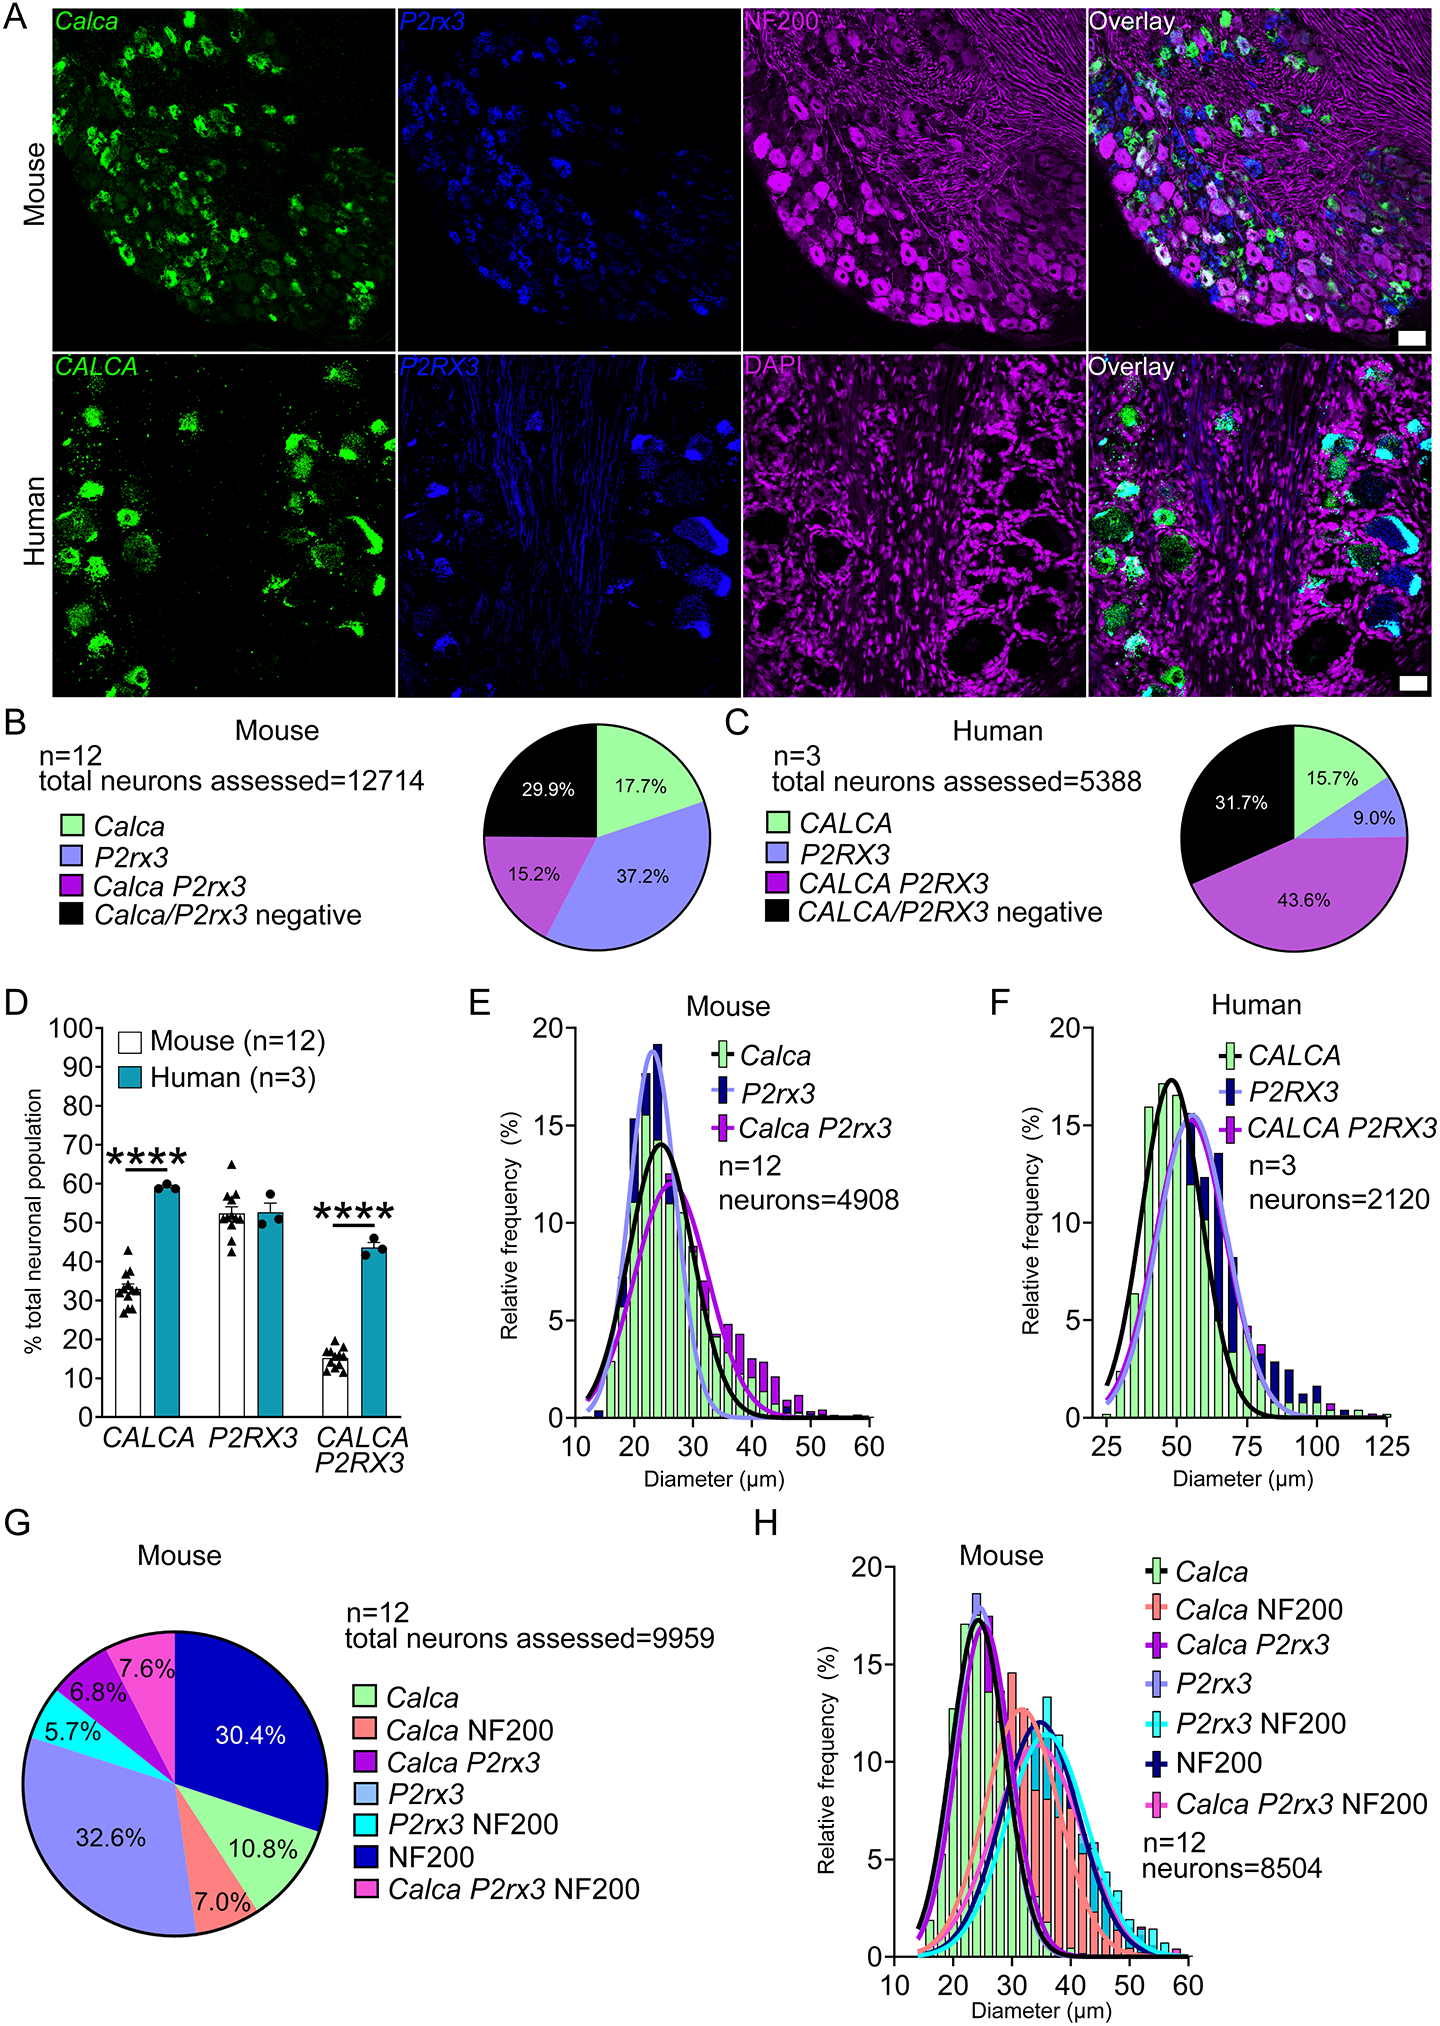
Figure 1. Distribution of peptidergic (CALCA; CGRP) and non-peptidergic (P2RX3; P2X3R) populations in mouse and human DRG.

A) Representative 20x images of mouse and human DRG labeled with RNAscope in situ hybridization for CALCA (green) and P2RX3 (blue) mRNA. Mouse and human DRG were costained for NF200 protein (purple) and DAPI (purple), respectively. B) Pie chart representation of CALCA and P2RX3 subpopulations in mouse and C) human DRG. D) The total number of CALCA-expressing neurons (all CALCA, and CALCA/P2RX3 neurons) was significantly increased in human DRG compared to mouse, but the population of P2RX3-expressing neurons (all P2RX3 and CALCA/P2RX3 neurons) was unchanged. The percentage of CALCA/P2RX3 co-expressing neurons was significantly increased in human DRG compared to mouse. E) Histogram with Gaussian distribution displaying the diameters of CALCA, P2RX3, and CALCA/P2RX3 co-expressing neurons in mouse and F) human DRG. G) Sensory neuron subpopulations were further divided in mouse DRG based on expression with Neurofilament-200 (NF200). H) Histogram with Gaussian distribution displaying the size distribution of Calca, P2rx3, and NF200 sensory neuron subpopulations in mouse DRG. Two way ANOVA with Bonferroni ****p<0.0001. Scale bar = 50 μm.
