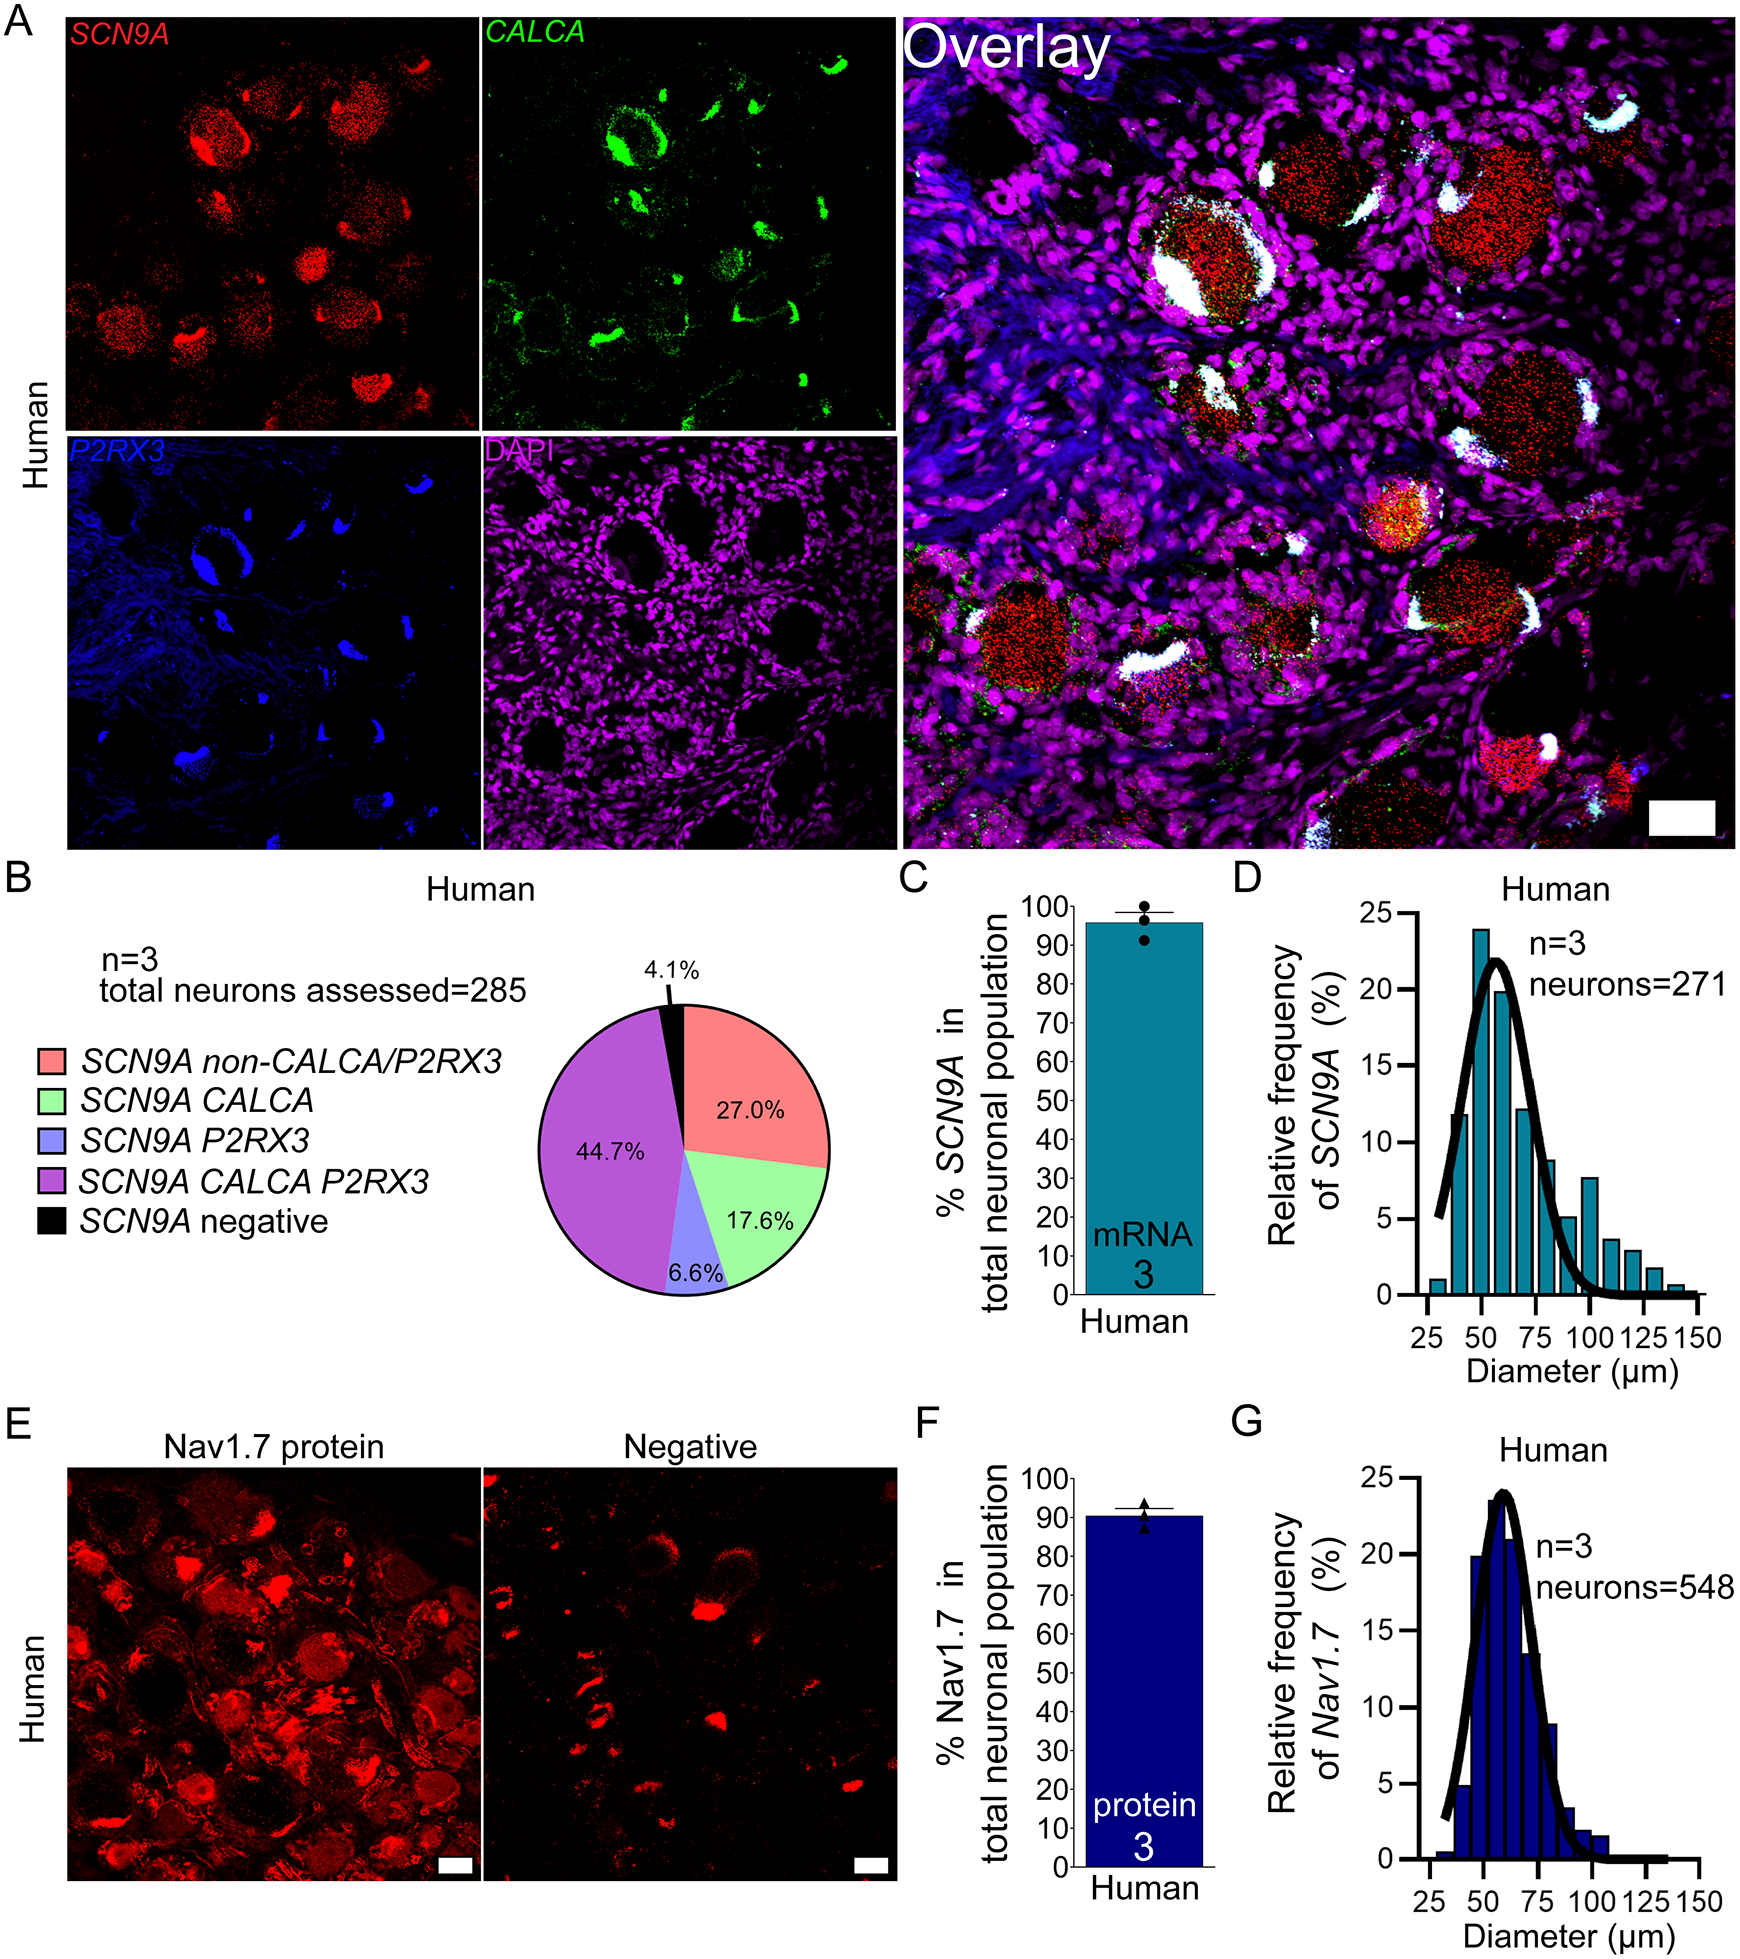
Figure 3. Distribution of SCN9A mRNA and Nav1.7 protein in human DRG.

A) Representative 20x images of human DRG labeled with RNAscope in situ hybridization for CALCA (green) and P2RX3 (blue), SCN9A (red), and DAPI (purple). B) Pie chart representation of all Scn9a-positive sensory neuron subpopulations in human DRG. C) SCN9A was expressed in 96% of sensory neurons in human DRG. D) Histogram with Gaussian distribution displaying the size profile of all SCN9A -positive neurons in human DRG. E) Representative 20x images of Nav1.7 (red) protein staining using a knockout-validated monoclonal antibody. The negative control was imaged at the same settings (no primary with secondary antibody). The negative control shows background lipofuscin (large globular structures) and myelin autofluorescence. F) Nav1.7 protein was expressed in 90.5% of sensory neurons in human DRG. G) Histogram with Gaussian distribution displaying the size profile of all Nav1.7 protein-positive neurons in human DRG. 20x scale bar = 50 μm.
