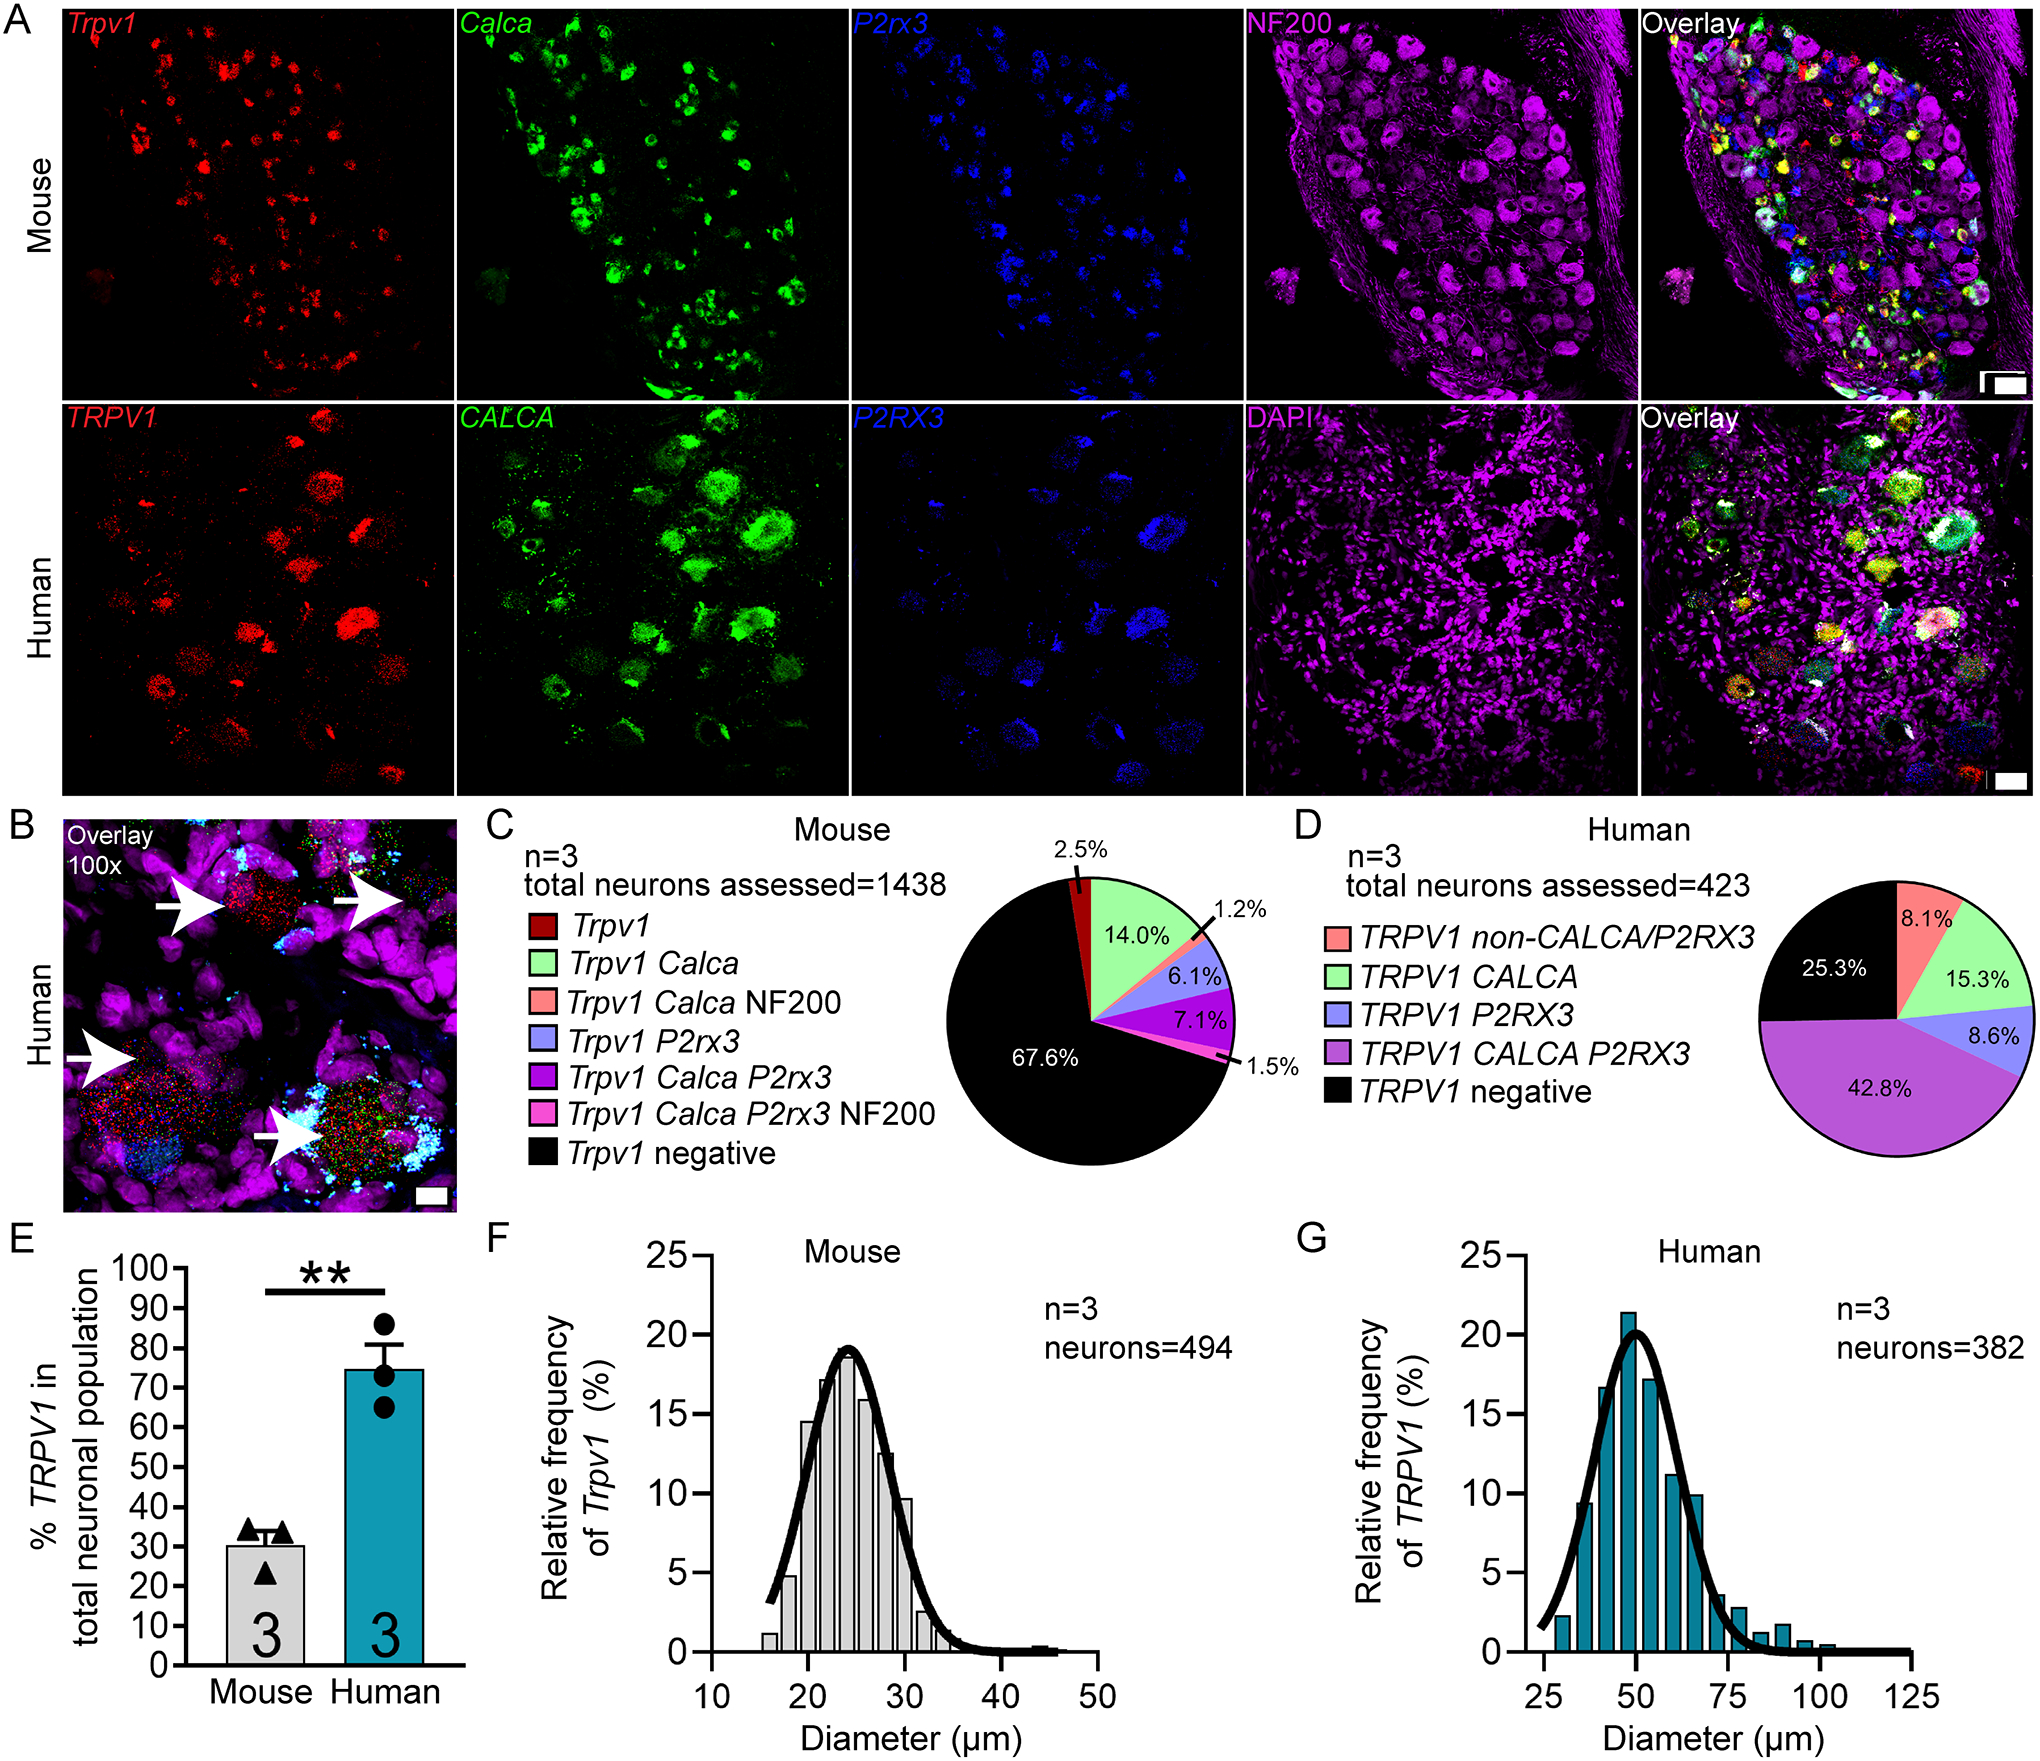
Figure 7. Distribution of TRPV1 mRNA in mouse and human DRG.

A) Representative 20x images of mouse and human DRG labeled with RNAscope in situ hybridization for CALCA (green), P2RX3 (blue), and TRPV1 (red) mRNA. Mouse and human DRG were costained for NF200 protein (purple) and DAPI (purple), respectively. B) Representative 100x overlay image showing CALCA (green), P2RX3 (blue), TRPV1 (red) and DAPI (purple) signal in human DRG. White arrows point toward Trpv1-positive neurons. C) Pie chart representation of all TRPV1-positive sensory neuron subpopulations in mouse and D) human DRG. E) TRPV1 was expressed in significantly more neurons in human DRG (74.7%) than in mouse DRG (32.4%). F) Histogram with Gaussian distribution displaying the size profile of all TRPV1-positive neurons in mouse and G) human DRG. Unpaired t-test, **p<0.01. 20x scale bar = 50 μm. 100x scale bar = 10 μm.
