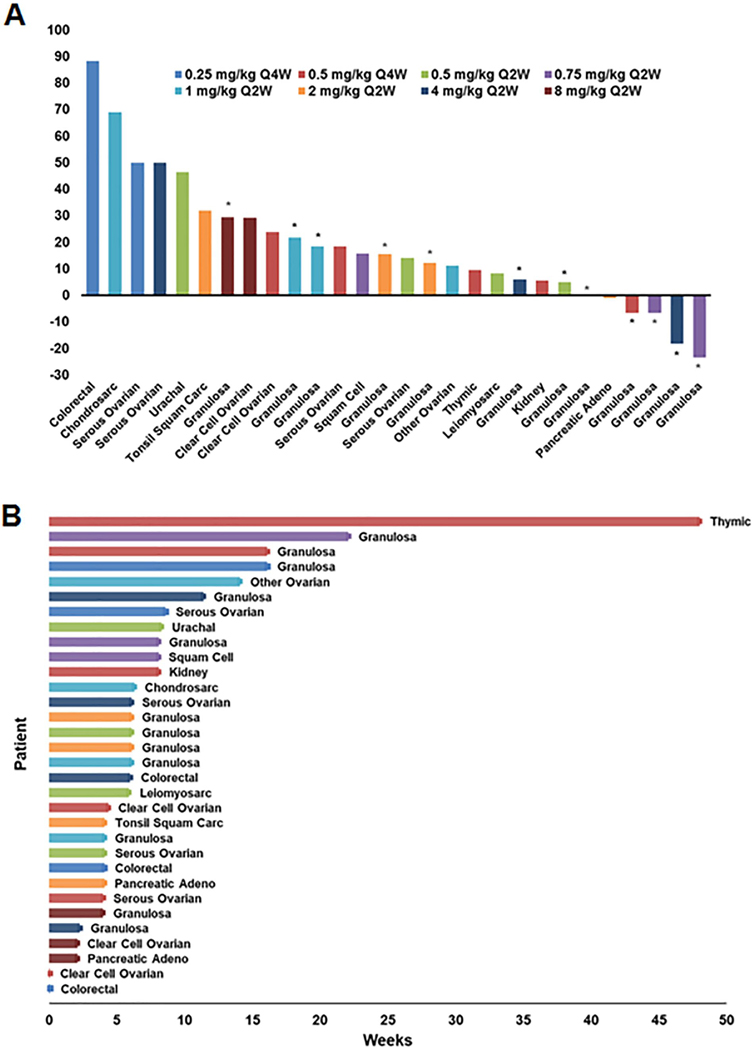
Figure 3: Greatest change in target lesions and duration of therapy.
A) Waterfall plotting showing the greatest change in target lesions by RECIST v1.1 criteria. Only patients with baseline and at least one post-baseline assessment of target lesion are included. Two patients in the efficacy population are not included in this figure. Colors (shown in legend) represent the different dose cohorts. Asterisks indicate that the tumor type is granulosa ovarian. B) Swimmer plot showing duration of therapy for the 32 patients who received STM 434.

