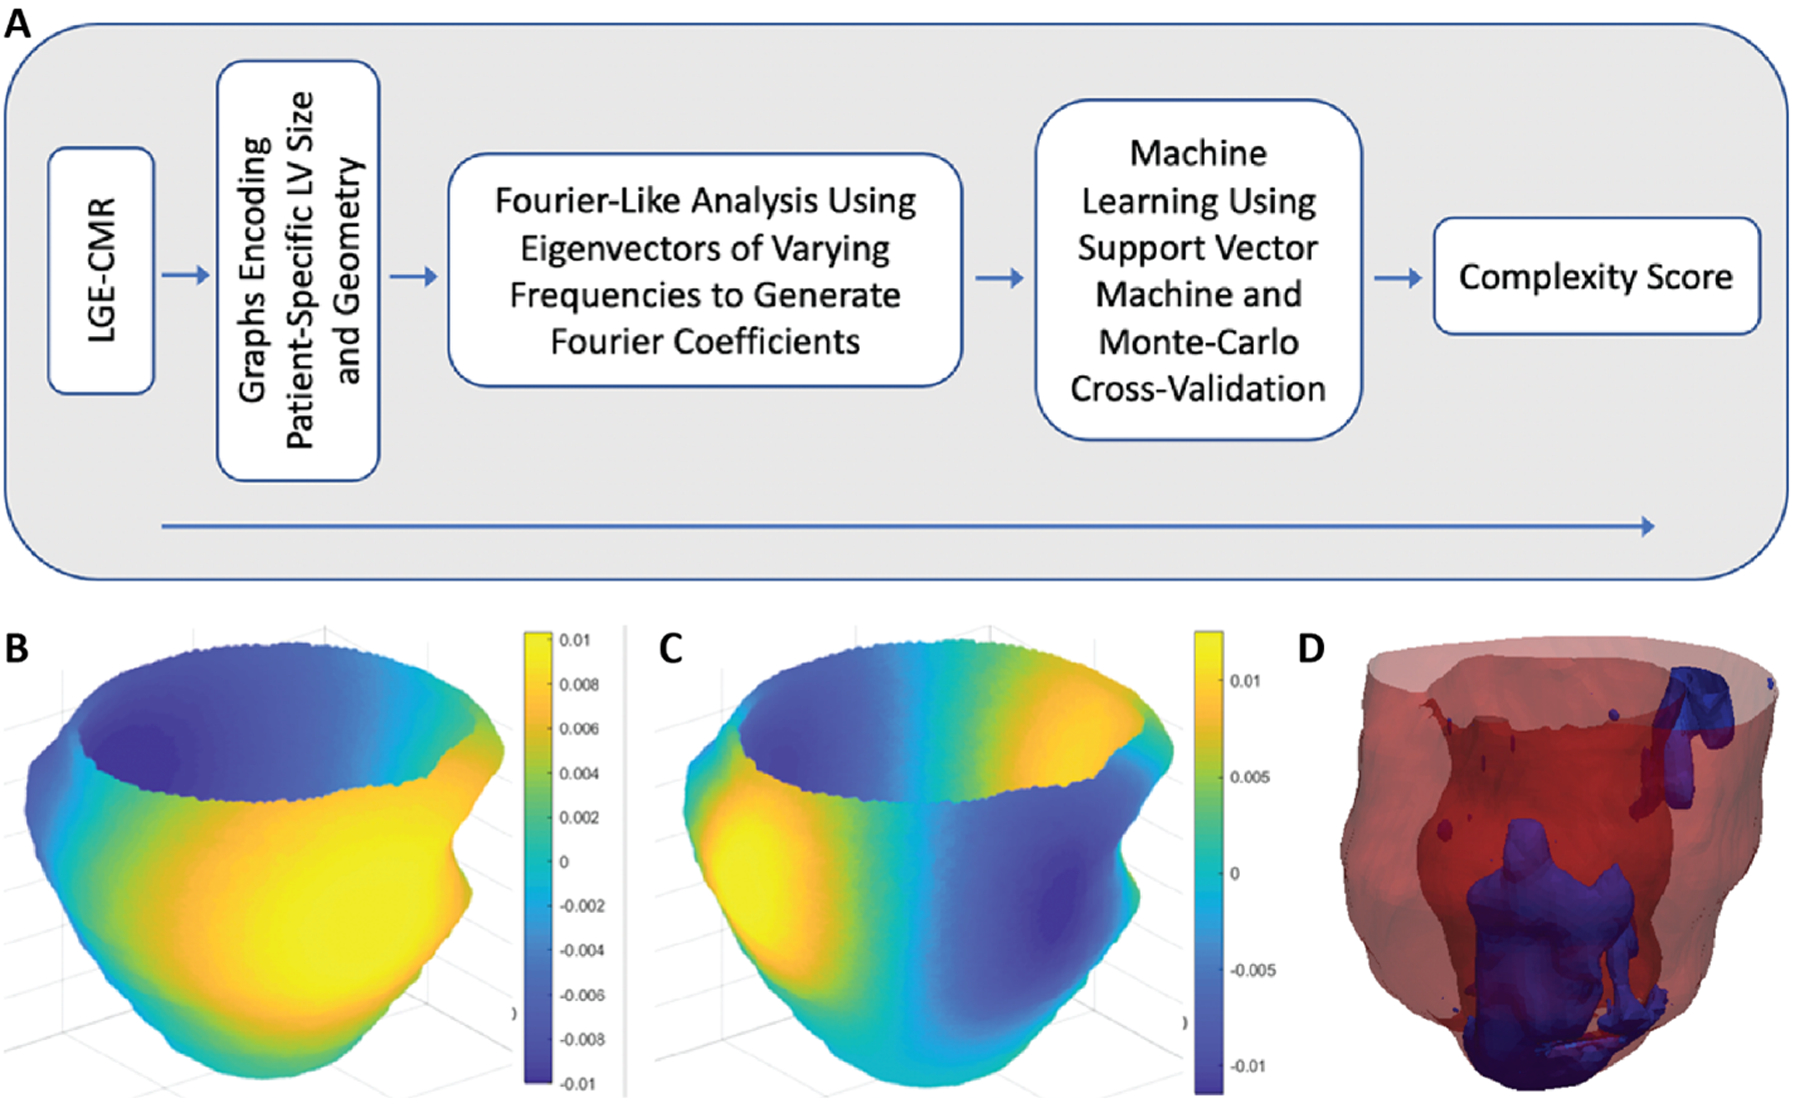
Figure 5. Substrate spatial complexity analysis.

(A) Flowchart of the analysis. Signal intensity patterns from cardiac LGE-MRI were analyzed using a Fourier-like technique for assessment of global irregularity. This analysis generated features that were used in an ML algorithm, which yielded a complexity score ranging from 0 to 1, where 0 represents low arrhythmic risk and 1 represents high arrhythmic risk. (B, C) Eigenvectors (sine-like functions) of varying frequencies oscillating over graphs encoding patient-specific LV size and geometry were compared with signal intensity patterns to generate Fourier coefficients. These coefficients were then used in the ML algorithm. Each panel (B and C) shows a different eigenvector frequency. Colors represent amplitude of the sine-like function. (D) Example of substrate spatial complexity analysis showing LGE-MRI-derived scar pattern from a patient with a low scar burden (12.1 g) but a high complexity score (CS; 0.99) who ultimately had a VA event. Modified from [82].
