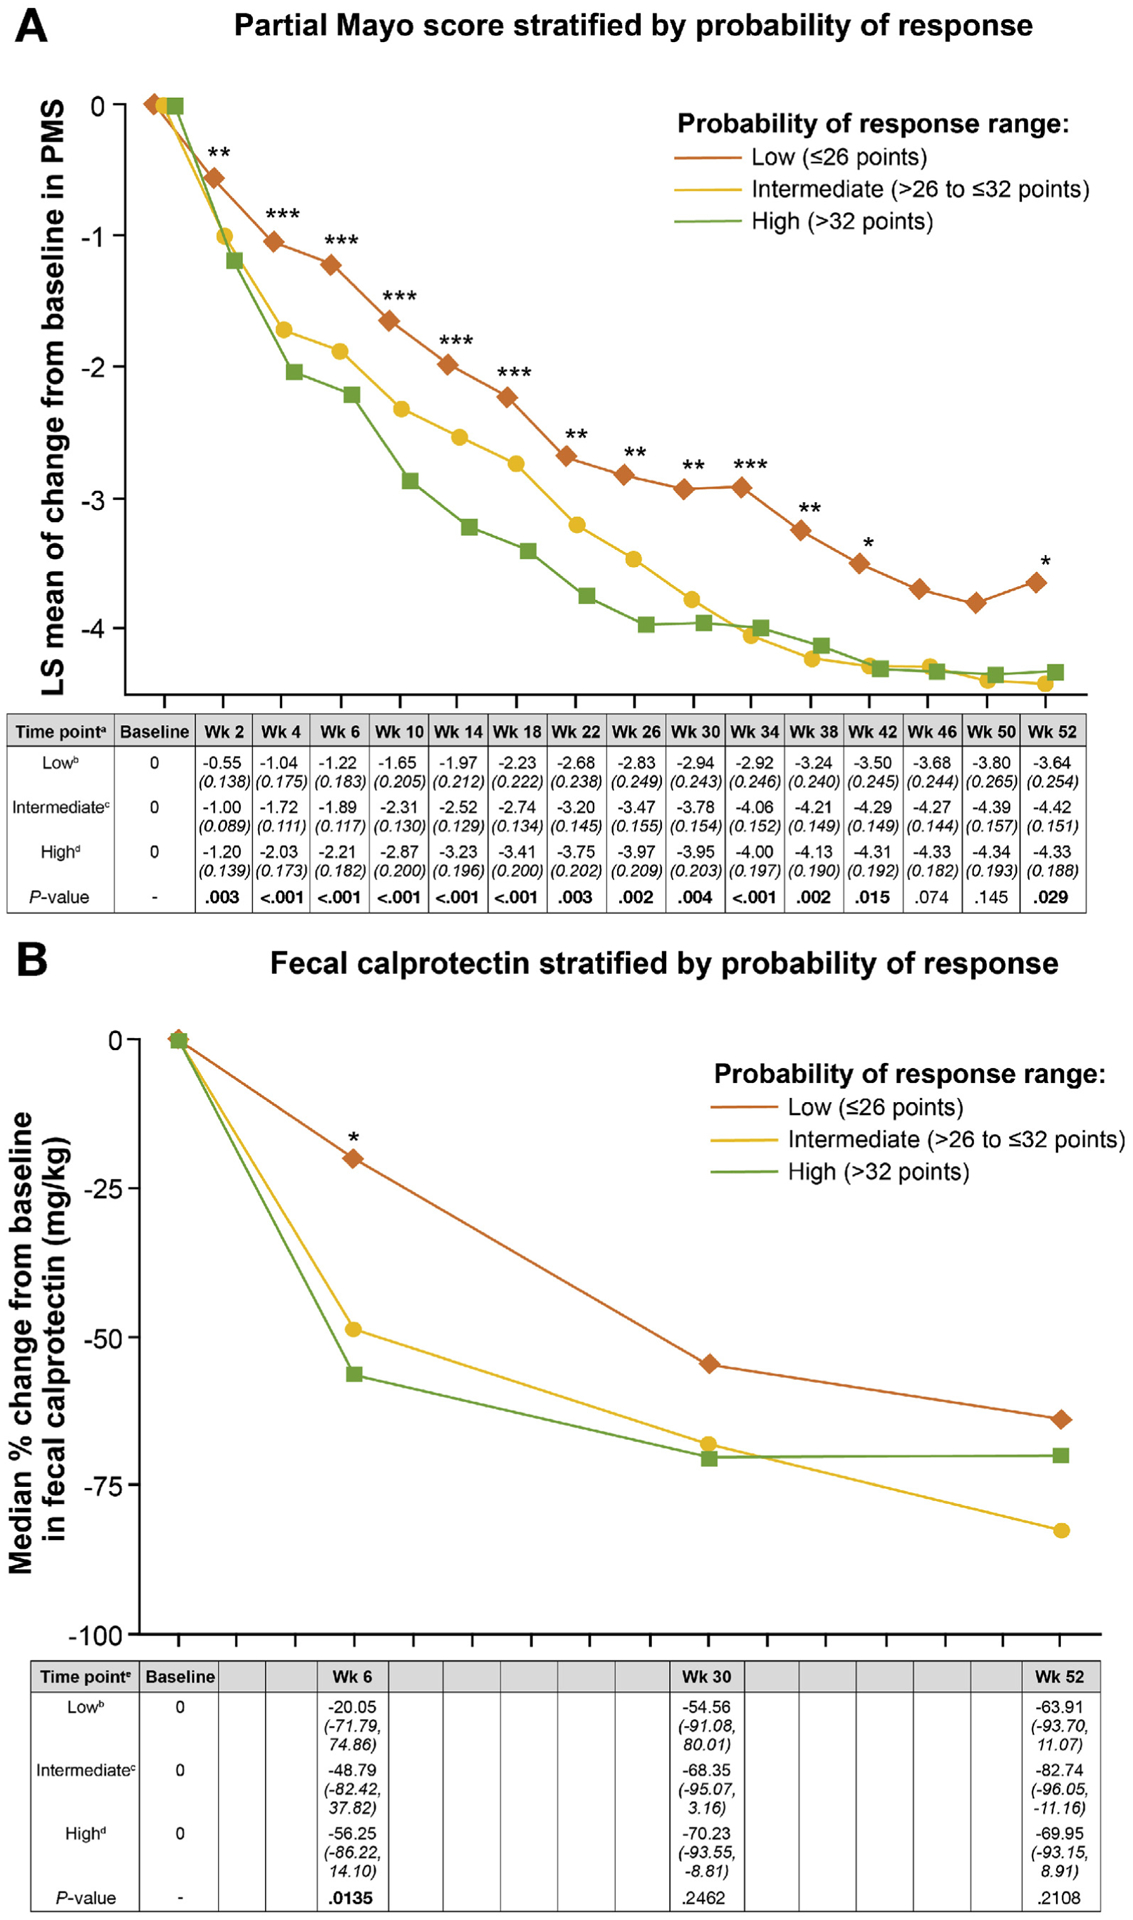
Figure 3.

Changes in (A) partial Mayo score and (B) fecal calprotectin in the GEMINI 1 trial cohort stratified by CDST. Statistical comparisons at each time point for partial Mayo score was done by ANOVA with type I error controlled based on a closed test procedure; fecal calprotectin statistical analysis was done using nonparametric testing (Kruskal-Wallis). *P < .05, **P < .01, ***P < .001 for both. aAll values in the table are least-squares (LS) mean partial Mayo score (PMS) (with standard error in parentheses). bLow probability; ≤26 points in the CDST model at baseline. cIntermediate probability; >26 to ≤32 points in the CDST model at baseline. dHigh probability; >32 points in the CDST model at baseline. eAll values in the table are median percent change in fecal calprotectin (interquartile range).
