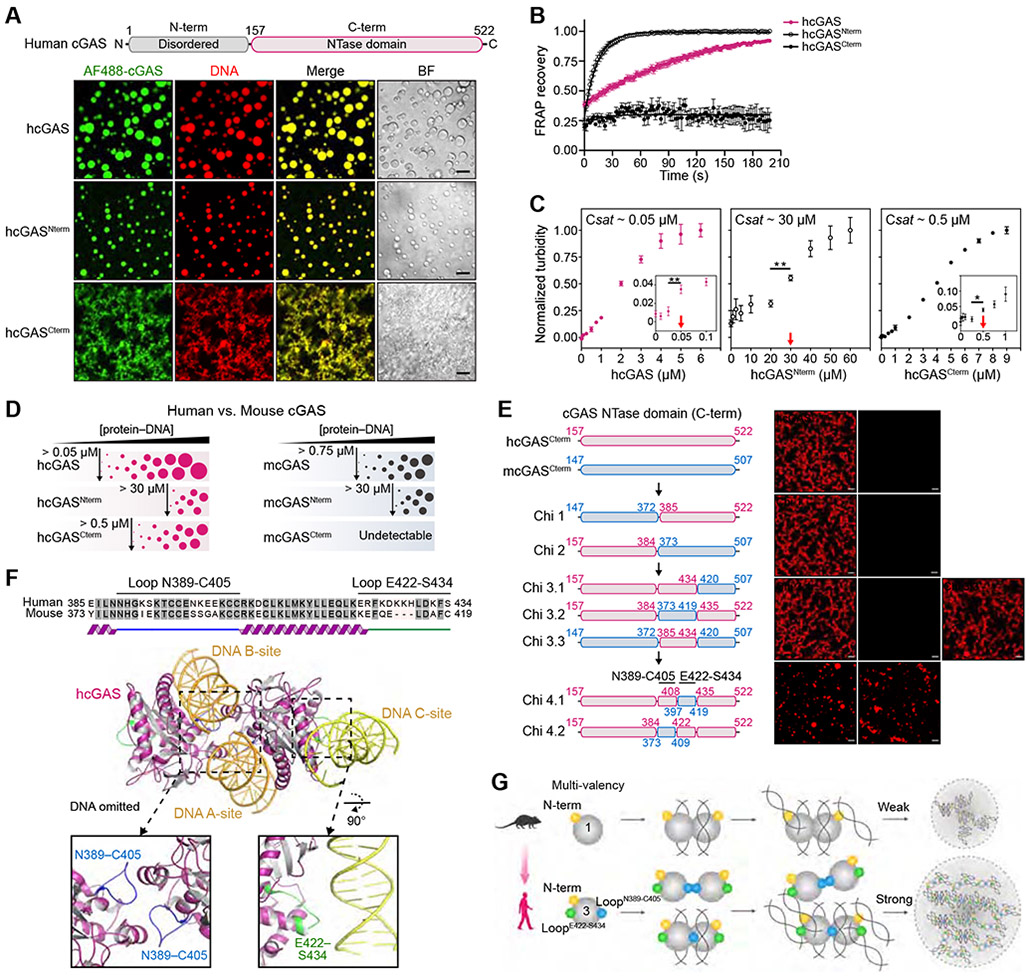
Figure 1. Molecular mechanism of cGAS-DNA phase separation.
(A) Top, schematic of the domain architecture of human cGAS (hcGAS). Bottom, fluorescence microscopy of DNA-induced phase separation of hcGAS proteins with bright field (BF) images. Recombinant hcGAS (10 μM), hcGASNterm (80 μM), and hcGASCterm (20 μM) were incubated with 100 bp dsDNA (10 μM) in buffer containing 250 mM (hcGAS), 150 mM (hcGASNterm), or 250 mM salt (hcGASCterm). Scale bar, 10 μm.
(B) FRAP analysis of cGAS-DNA phase-separated condensates. Time 0 indicates the time of photobleaching. Data represent the mean ± SEM of 7 droplets in 3 independent experiments.
(C) Analysis of relative saturation concentrations of cGAS proteins by turbidity assay. A series of concentrations of protein with 100 bp dsDNA (equal amounts) were mixed at 150 mM salt, and the absorbance of 340 nm was used as the readout of turbidity. The relative saturation concentrations are indicated with red arrows. All data are expressed as the mean ± SEM of more than 5 independent experiments. Statistical significance was calculated with a two-tailed T test, **p = <0.01, *p = <0.1.
(D) Schematic representing the phase behaviors and saturation concentrations of hcGAS and mouse cGAS (mcGAS) proteins determined by fluorescence intensity as in Figures S1F,G and S2C,D.
(E) Chimera experiments mapping the molecular determinant of enhanced human cGAS phase separation to two loops hcGAS N389–C405 and E422–S434. Left, schematic of cGAS constructs. Amino acid numbers are colored magenta for hcGAS and blue for mcGAS. Right, fluorescence microscopy images analyzing phase separation. cGAS chimeras (10 μM) were incubated with 100 bp dsDNA (10 μM) at 150 mM salt. Scale bar, 10 μm.
(F) Structure of the hcGAS–DNA complex (derived from combining PDB 6CT9 and additional DNA from PDB 6EDB) and schematic highlight of the mapped hcGAS loop sequences required for enhancement of cGAS–DNA phase separation.
(G) Cartoon model of the molecular basis of cGAS-DNA phase separation.
See also Figures S1, S2, and Video S1.

