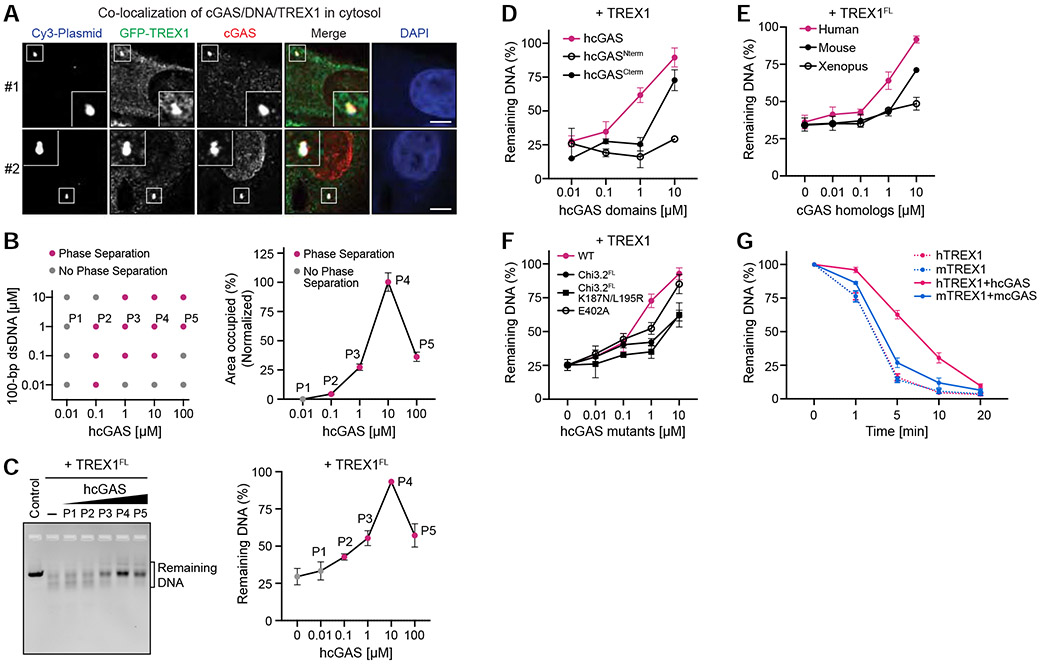
Figure 3. cGAS phase separation resists DNA degradation by exonuclease TREX1.
(A) Imaging of co-localization of cGAS/DNA/TREX1 in the cell cytosol (see STAR Methods). cGAS staining indicates that cGAS predominantly localizes in either the cytosol (#1) or nucleus (#2). Scale bar, 5 μm.
(B) Left, phase diagram of purified hcGAS under various protein and DNA concentrations at 150 mM salt, where grey dots indicate no phase separation, and magenta dots indicate observable condensate formation (see also C). Right, quantification of phase separation with 1 μM DNA and increasing concentration of hcGAS. Data represent the percent area of the image occupied by condensates relative to the maximal phase separation observed with 10 μM hcGAS and are plotted as the mean ± SEM of 17 images from 3 independent experiments.
(C) cGAS phase separation protects DNA from TREX1 degradation. Left, in vitro analysis of DNA degradation by full-length TREX1 (TREX1FL) in the presence of varying degrees of cGAS-DNA phase separation. Phase separation was induced with increasing cGAS concentration as shown in (B) in the presence of 1 μM 100-bp dsDNA, and DNA degradation was measured by incubating with purified TREX1FL and resolving the remaining DNA on an agarose gel. Right, quantification of remaining DNA. Data represent the mean ± SEM of 5 independent experiments.
(D) Analysis of the TREX1 resistance by individual cGAS domains. Phase separation was induced with 1 μM DNA and titrations of N-term and C-term cGAS at indicated concentrations. DNA degradation was then initiated by adding TREX1 (M1–K242) at 0.1 μM. Remaining DNA was quantified as in (C). Data are represented as the mean ± SEM of 3 independent experiments.
(E) Analysis of TREX1 resistance by cGAS homologs. Phase separation was induced with 1 μM DNA and a titration of cGAS homolog protein as indicated. DNA degradation was measured as in (C). Data represent the mean ± SEM of 3 independent experiments.
(F) Inhibition of cGAS-DNA phase separation reduces TREX1 resistance. DNA degradation by TREX1 was measured in the presence of hcGAS or hcGAS mutants. Experiments were performed and data were quantified as in (C). Data are represented as the mean ± SEM of 4 independent experiments.
(G) Analysis of species-specific TREX1 resistance by cGAS-DNA phase separation. Human and mouse TREX1 (hTREX1 and mTREX1) DNase activity was assessed in the absence or presence of cGAS phase separation as indicated. Remaining DNA was resolved on an agarose gel and quantified. Data represent the mean ± SEM of 4 independent experiments.
See also Figure S4.

