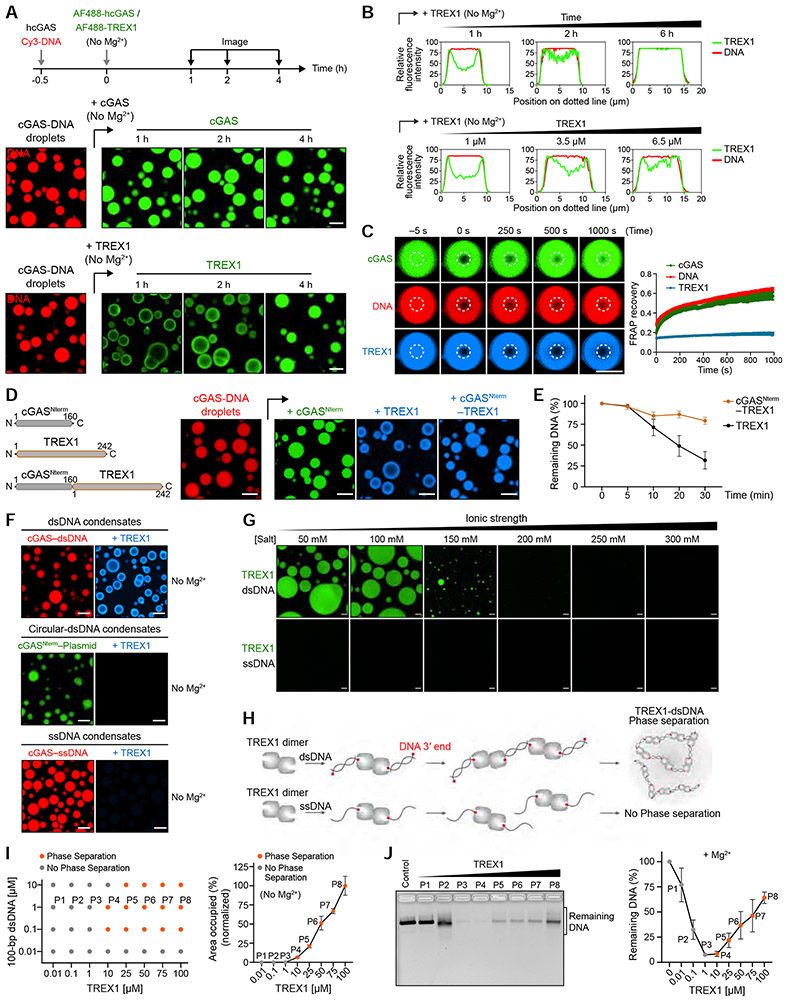
Figure 5. Phase separation is a direct suppressor of TREX1 exonuclease activity.
(A) Time-lapse imaging of slower partitioning of TREX1 into cGAS-DNA droplets compared to cGAS. cGAS-DNA droplets were preformed as indicated, and the incorporation rates of TREX1 and cGAS were tracked using fluorescently labeled components. Scale bar, 10 μm.
(B) Line-scanning analysis of TREX1 incorporation demonstrates that TREX1 migration to the center of cGAS-DNA droplets requires extended incubation times (top) or elevated TREX1 protein levels (bottom).
(C) Analysis of the fluidity of TREX1, cGAS and DNA in cGAS-DNA droplets. cGAS-DNA droplets were incubated for 4 h to allow complete incorporation of TREX1 and then analyzed by FRAP to measure component fluidity. Time 0 indicates the time of photo bleaching. Plots are generated from 12 droplets and data represent the mean ± SEM of 3 independent experiments.
(D) Schematic of engineered cGAS-TREX1 fusion constructs developed to permit rapid incorporation of TREX1 into cGAS-DNA droplets (Left). Right, fluorescence microscopy images of construct incorporation into preformed cGAS-DNA droplets as in Figure 4G. Scale bar, 10 μm.
(E) Entry into cGAS-DNA droplets restricts TREX1 nuclease activity. Following induction of cGAS-DNA phase separation, DNA degradation was initiated with addition of TREX1 or cGASNterm–TREX1 and remaining DNA was quantified by agarose gel analysis. Data represent the mean ± SEM of 3 independent experiments.
(F) Fluorescence microscopy images of TREX1 interactions with cGAS-DNA droplets formed with linear dsDNA, closed circular dsDNA, or ssDNA. Scale bar, 10 μm.
(G) Fluorescence microscopy images showing dsDNA-induced phase separation of TREX1. TREX1-dsDNA droplet formation was induced by TREX1 (20 μM) and 100-bp dsDNA (10 μM) at various salt concentrations as indicated. Scale bar, 10 μm.
(H) Schematic of hypothetical TREX1-dsDNA interactions that drive liquid-liquid phase separation.
(I) Left, phase diagram of purified TREX1 under various protein and dsDNA concentrations at 150 mM salt with no MgCl2. Dots indicate conditions where a single phase (grey) or two phases (orange) are present. Right, quantification of TREX1-dsDNA phase separation with 1 μM dsDNA and increasing concentration of TREX1. Data correspond to the percent area of the image occupied by droplets and were quantified relative to maximal phase separation observed with 100 μM TREX1. Data represent the mean ± SEM of 7 images in 3 independent experiments.
(J) TREX1-dsDNA phase separation inhibits TREX1 exonuclease activity. TREX1-dsDNA phase separation was induced with 100-bp dsDNA and increasing TREX1 concentration as shown in (I) in the presence of 5 mM MgCl2. Reactions were inactivated and DNA was quantified by agarose gel analysis. Data represent the mean ± SEM of 3 independent experiments.
See also Figures S5, S6, and Video S4.

