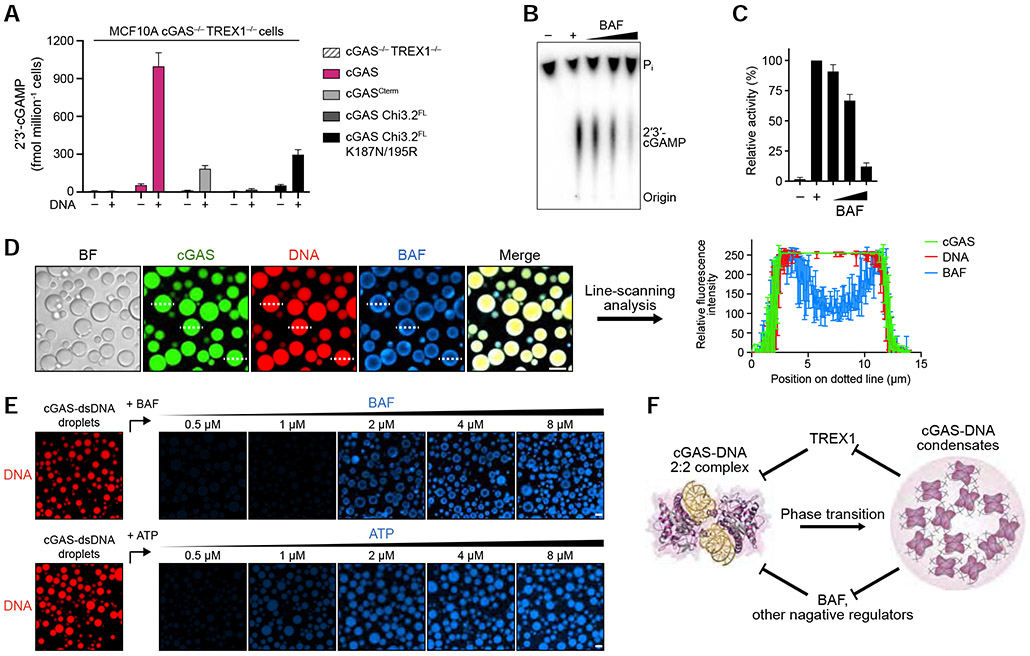
Figure 7. cGAS phase separation resists immune suppression by multiple negative regulators.
(A) ELISA analysis of 2′3′-cGAMP production in MCF10A cGAS−/− TREX1−/− cells reconstituted with hcGAS or hcGAS mutant alleles and transfected with plasmid DNA. Data are the mean ± SD of 3 experiments.
(B,C) In vitro analysis of BAF-dependent inhibition of cGAS 2′3′-cGAMP synthesis. Purified hcGAS enzyme was stimulated with 100-bp DNA in reactions supplemented with an increasing concentration of BAF and 2′3′-cGAMP production was analyzed and quantified as in Figure S1B. Data represent the mean ± SEM of 4 independent experiments.
(D) Fluorescence microscopy images (left) and line-scanning analysis (right) showing that BAF is excluded to an outer shell at the cGAS-DNA droplet periphery. cGAS-DNA droplet formation was induced as in Figure 4D. Scale bar, 10 μm. Fluorescence intensity along the dotted lines was analyzed (right). Plots are generated from 3 droplets and data represent the mean ± SD.
(E) Fluorescence microscopy images of dosage-dependent incorporation of BAF and ATP into cGAS-DNA droplets. cGAS-dsDNA droplet formation was induced as in Figure 5A, and BAF/ATP incorporation was analyzed with increasing concentration of AF647-labeled BAF (top) or AF647-labeled ATP (bottom). Scale bar, 10 μm.
(F) Model of the role of cGAS-DNA phase separation in resisting negative regulation. DNA-induced cGAS phase separation creates a selective environment that suppresses entry of negative regulators and allows sensing of immunostimulatory DNA.
See also Figure S7.

