
Figure 1.
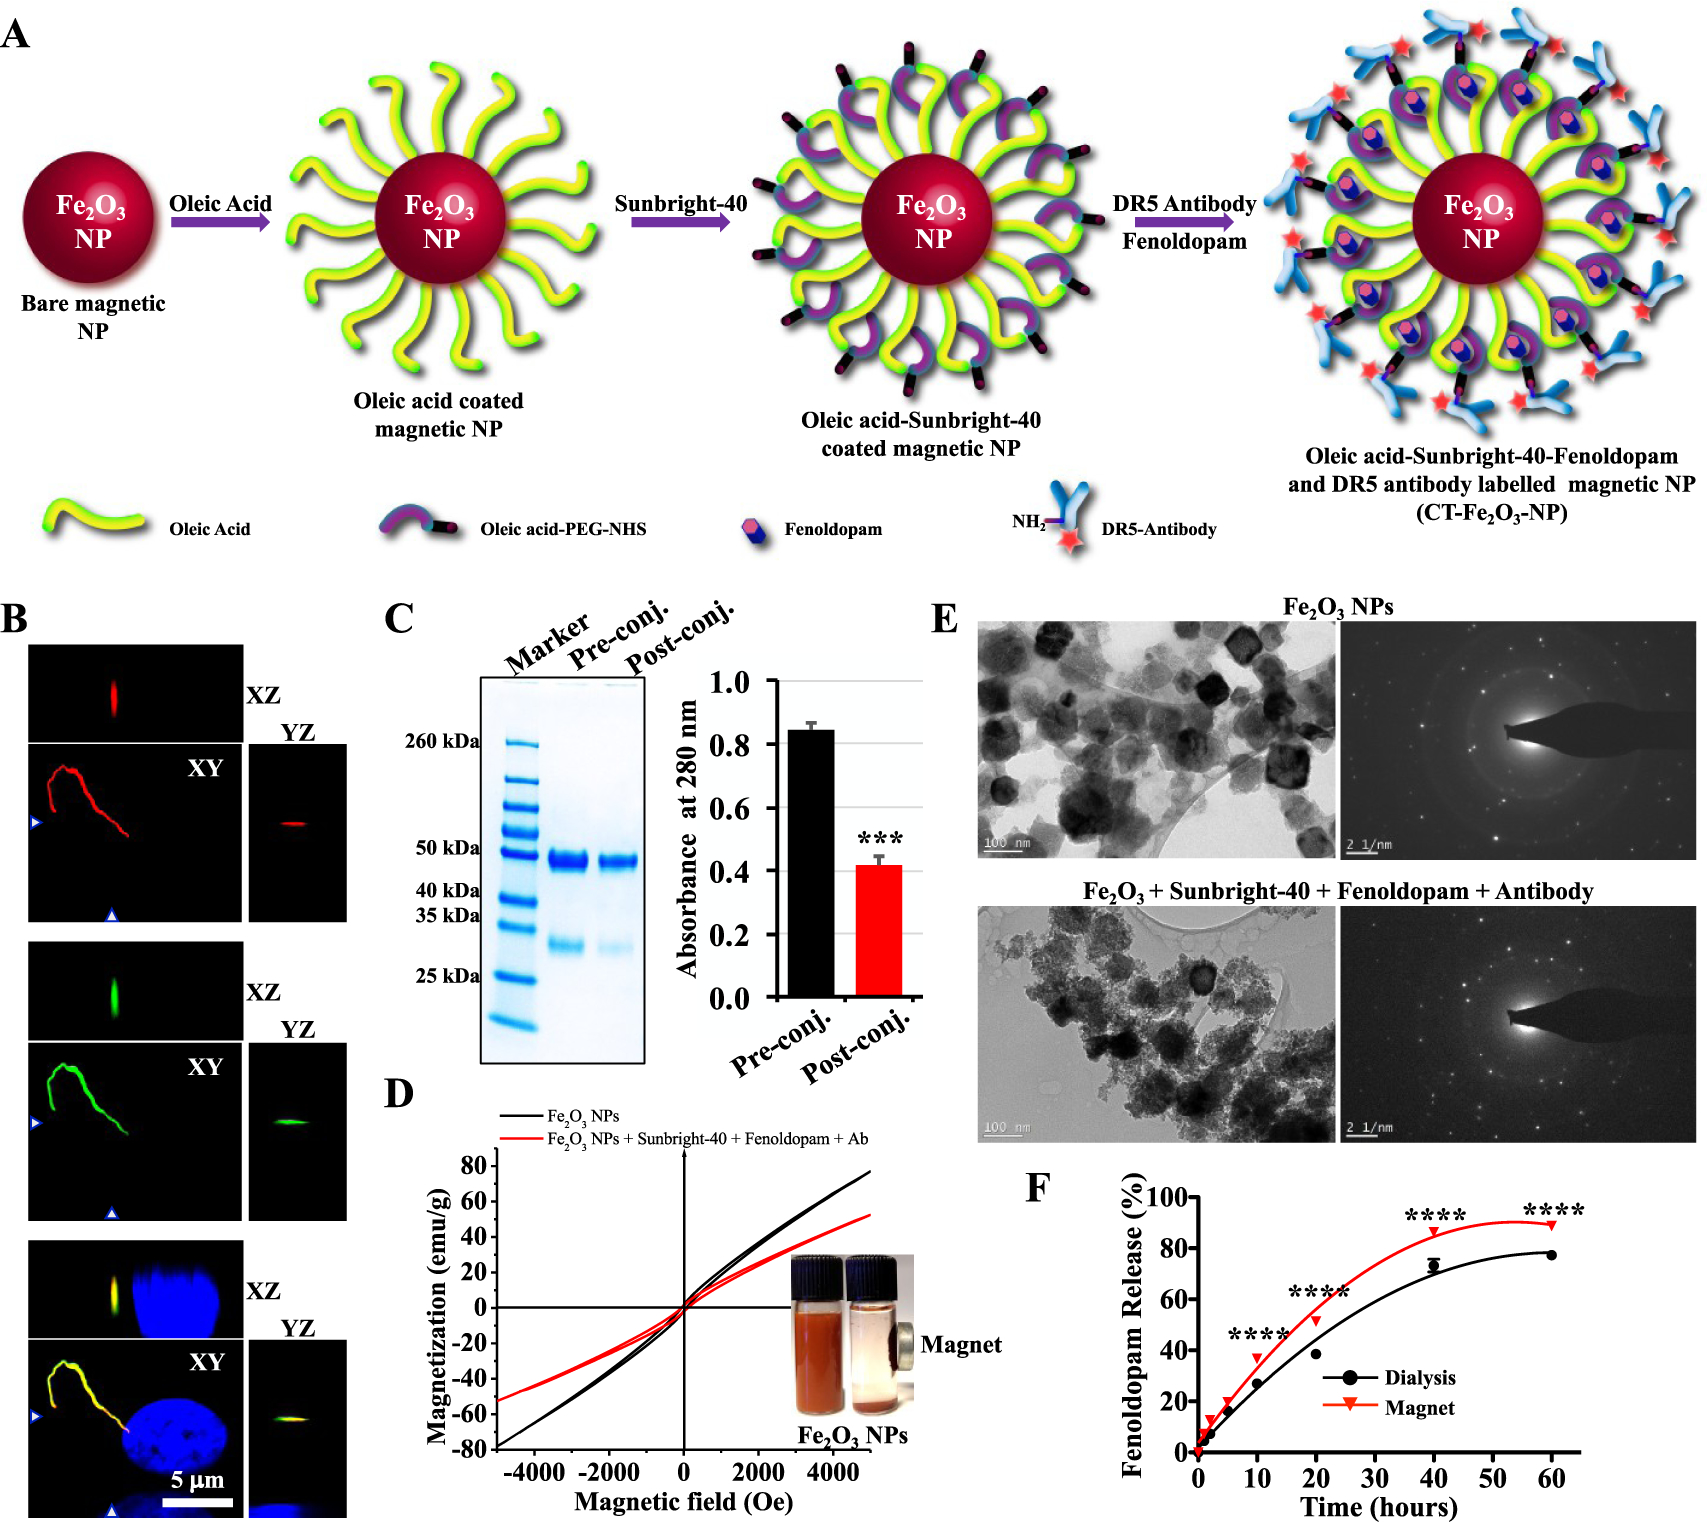
Preparation and characterization of the CT-Fe2O3-NPs. (A) Synthesis and surface functionalization of the CT-Fe2O3-NPs. (B) Reconstructed fluorescence images of cells showing DR5 localization to the primary cilium. (C) SDS-PAGE image showing a reduction in the amount of antibody in the supernatant before and after the conjugation reaction. The bar graph shows the antibody concentrations in the pre and postconjugation solutions quantified by measuring the A280. (D) Hysteresis loops of bare Fe2O3-NPs and the CT-M-Fe2O3-NPs showing the superparamagnetic characteristics of the CT-M-Fe2O3-NPs in the dispersed form. The inset photograph shows the particles dispersed in water with and without magnetic separation. (E) TEM and selected area electron diffraction (SAED) micrographs showing bare Fe2O3-NPs and the CT-M-Fe2O3-NPs. (F) The release profile of fenoldopam from the CT-M-Fe2O3-NPs in PBS was compared using a dialysis method and magnetic rotations. N = 3 for all experiments; ****, p < 0.0001 between groups.