
Figure 3.
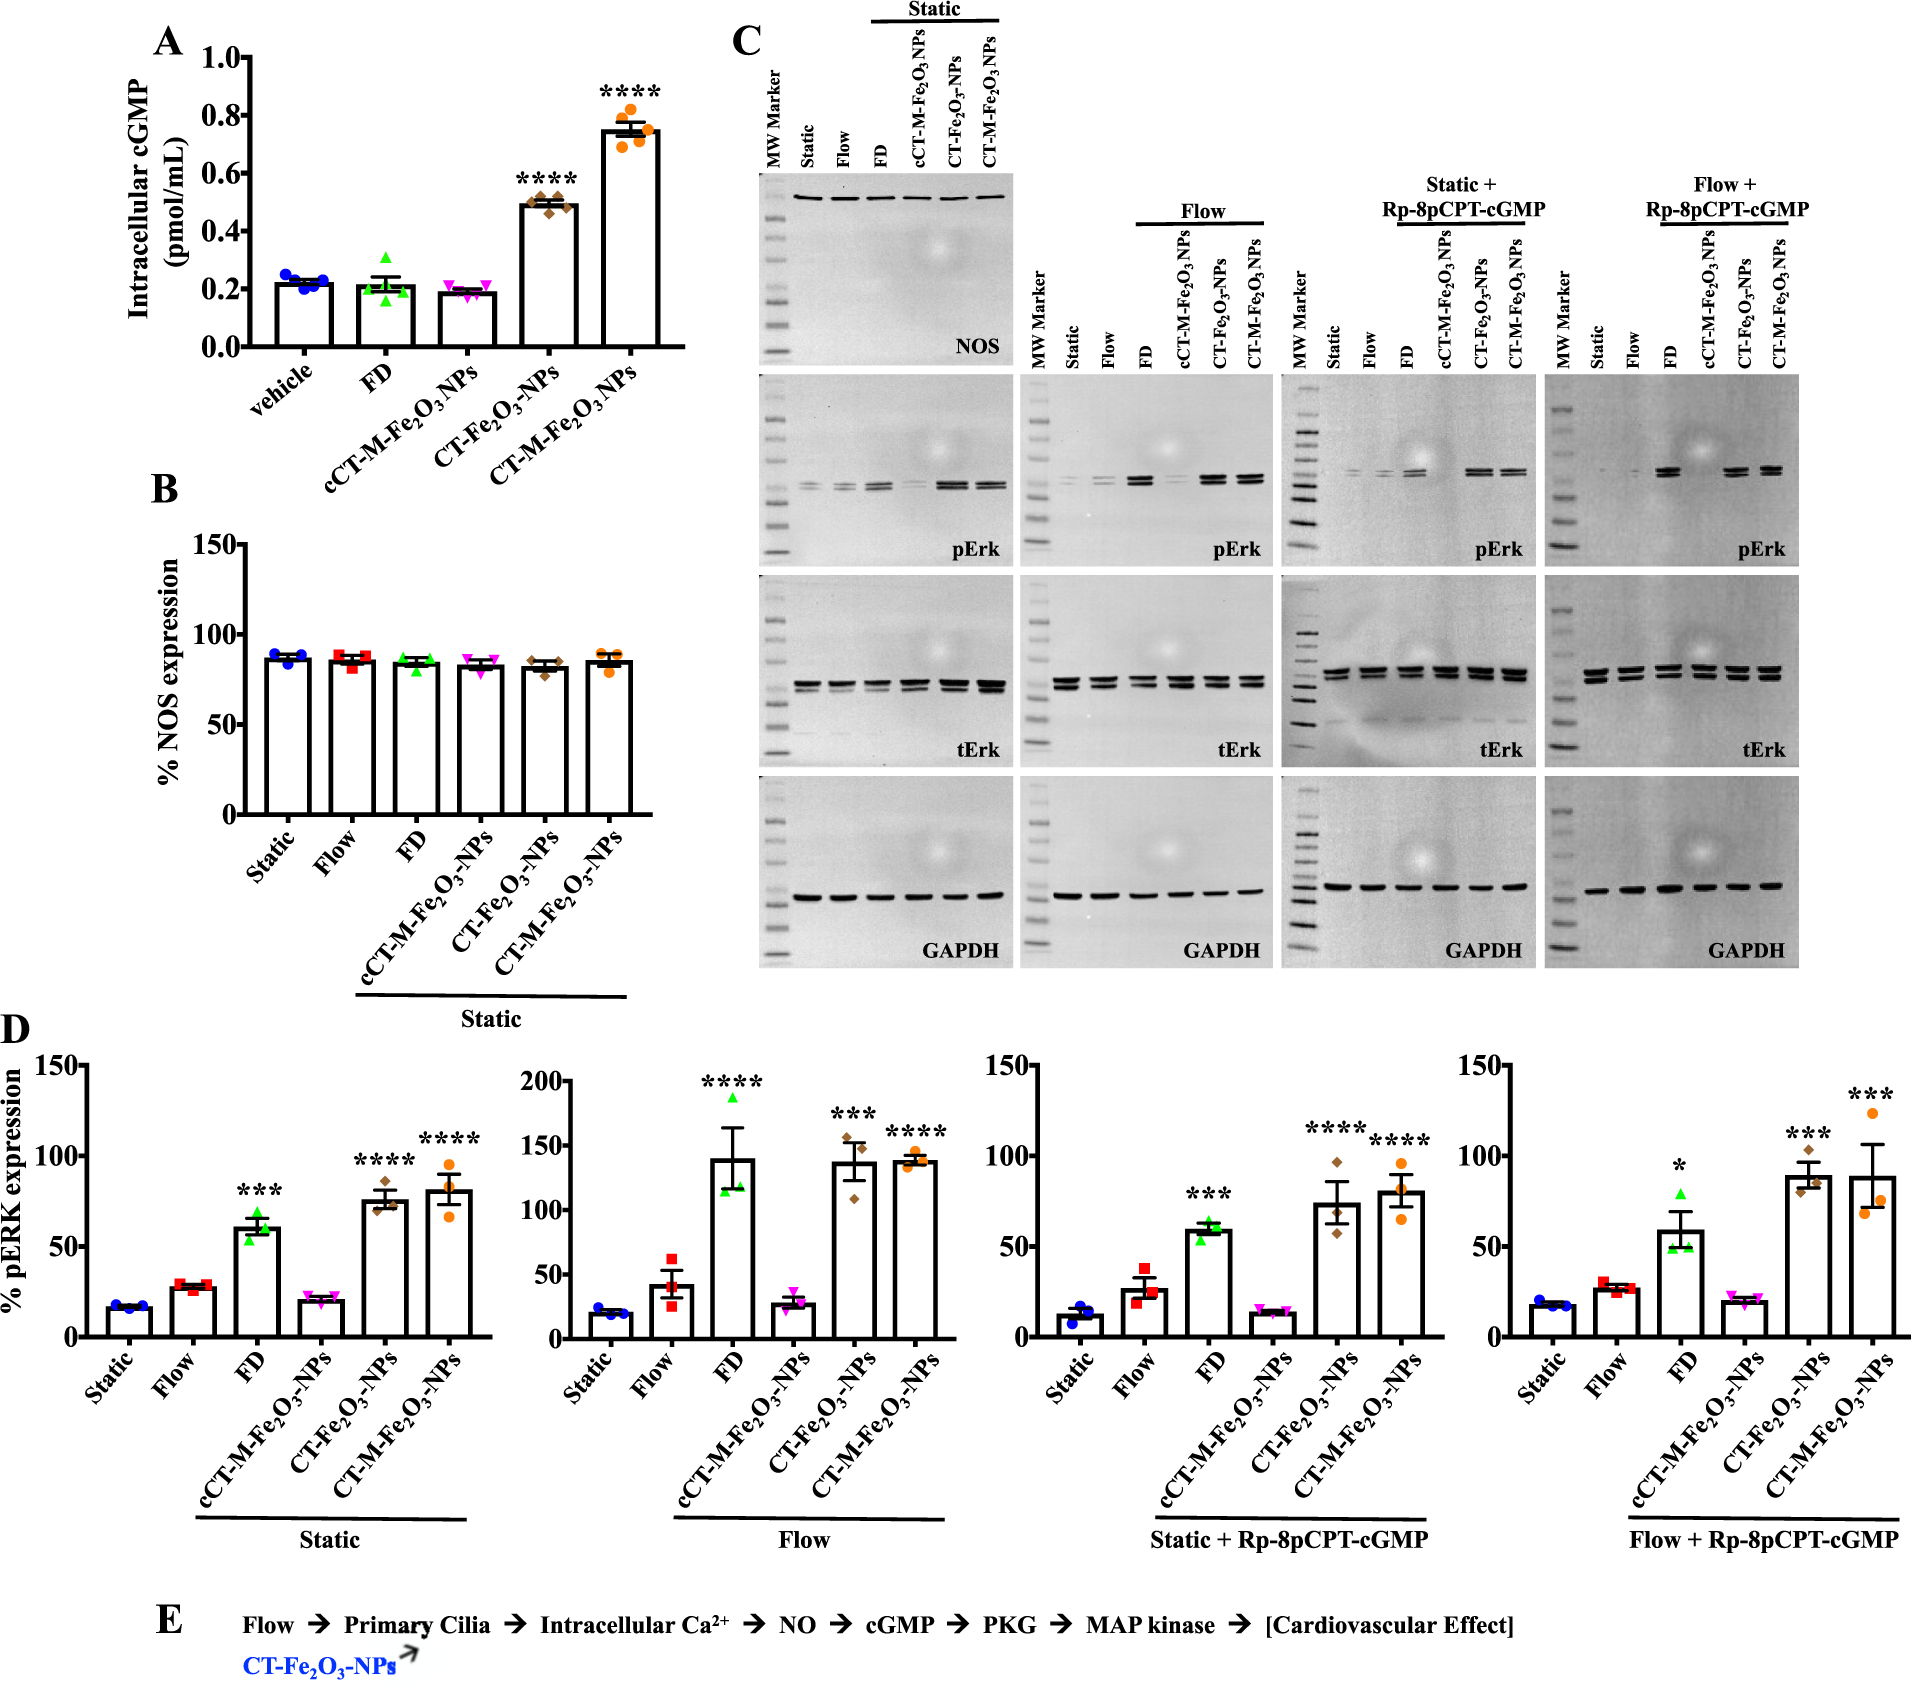
Measurements of cGMP and phosphorylated ERK levels. (A) Intracellular cGMP levels were quantified in cells treated with PBS (vehicle), fenoldopam, and different types of CT-NPs. (B) Percent expression of NOS under static and flow conditions. (C) Representative immunoblots of cell lysates collected before (static) and after fluid shear-stress (flow) in the absence or presence of the PKG inhibitor Rp-8pCPT-cGMP. (D) Immunoblot data for p-ERK are shown in dot-plotted bar graphs. (E) Schematic showing the proposed signaling pathway. N = 4 samples per group in each study; *, p < 0.05; **, p < 0.01; ***, p < 0.001; and ****, p < 0.0001 compared with the control (static) group.