
Figure 6.
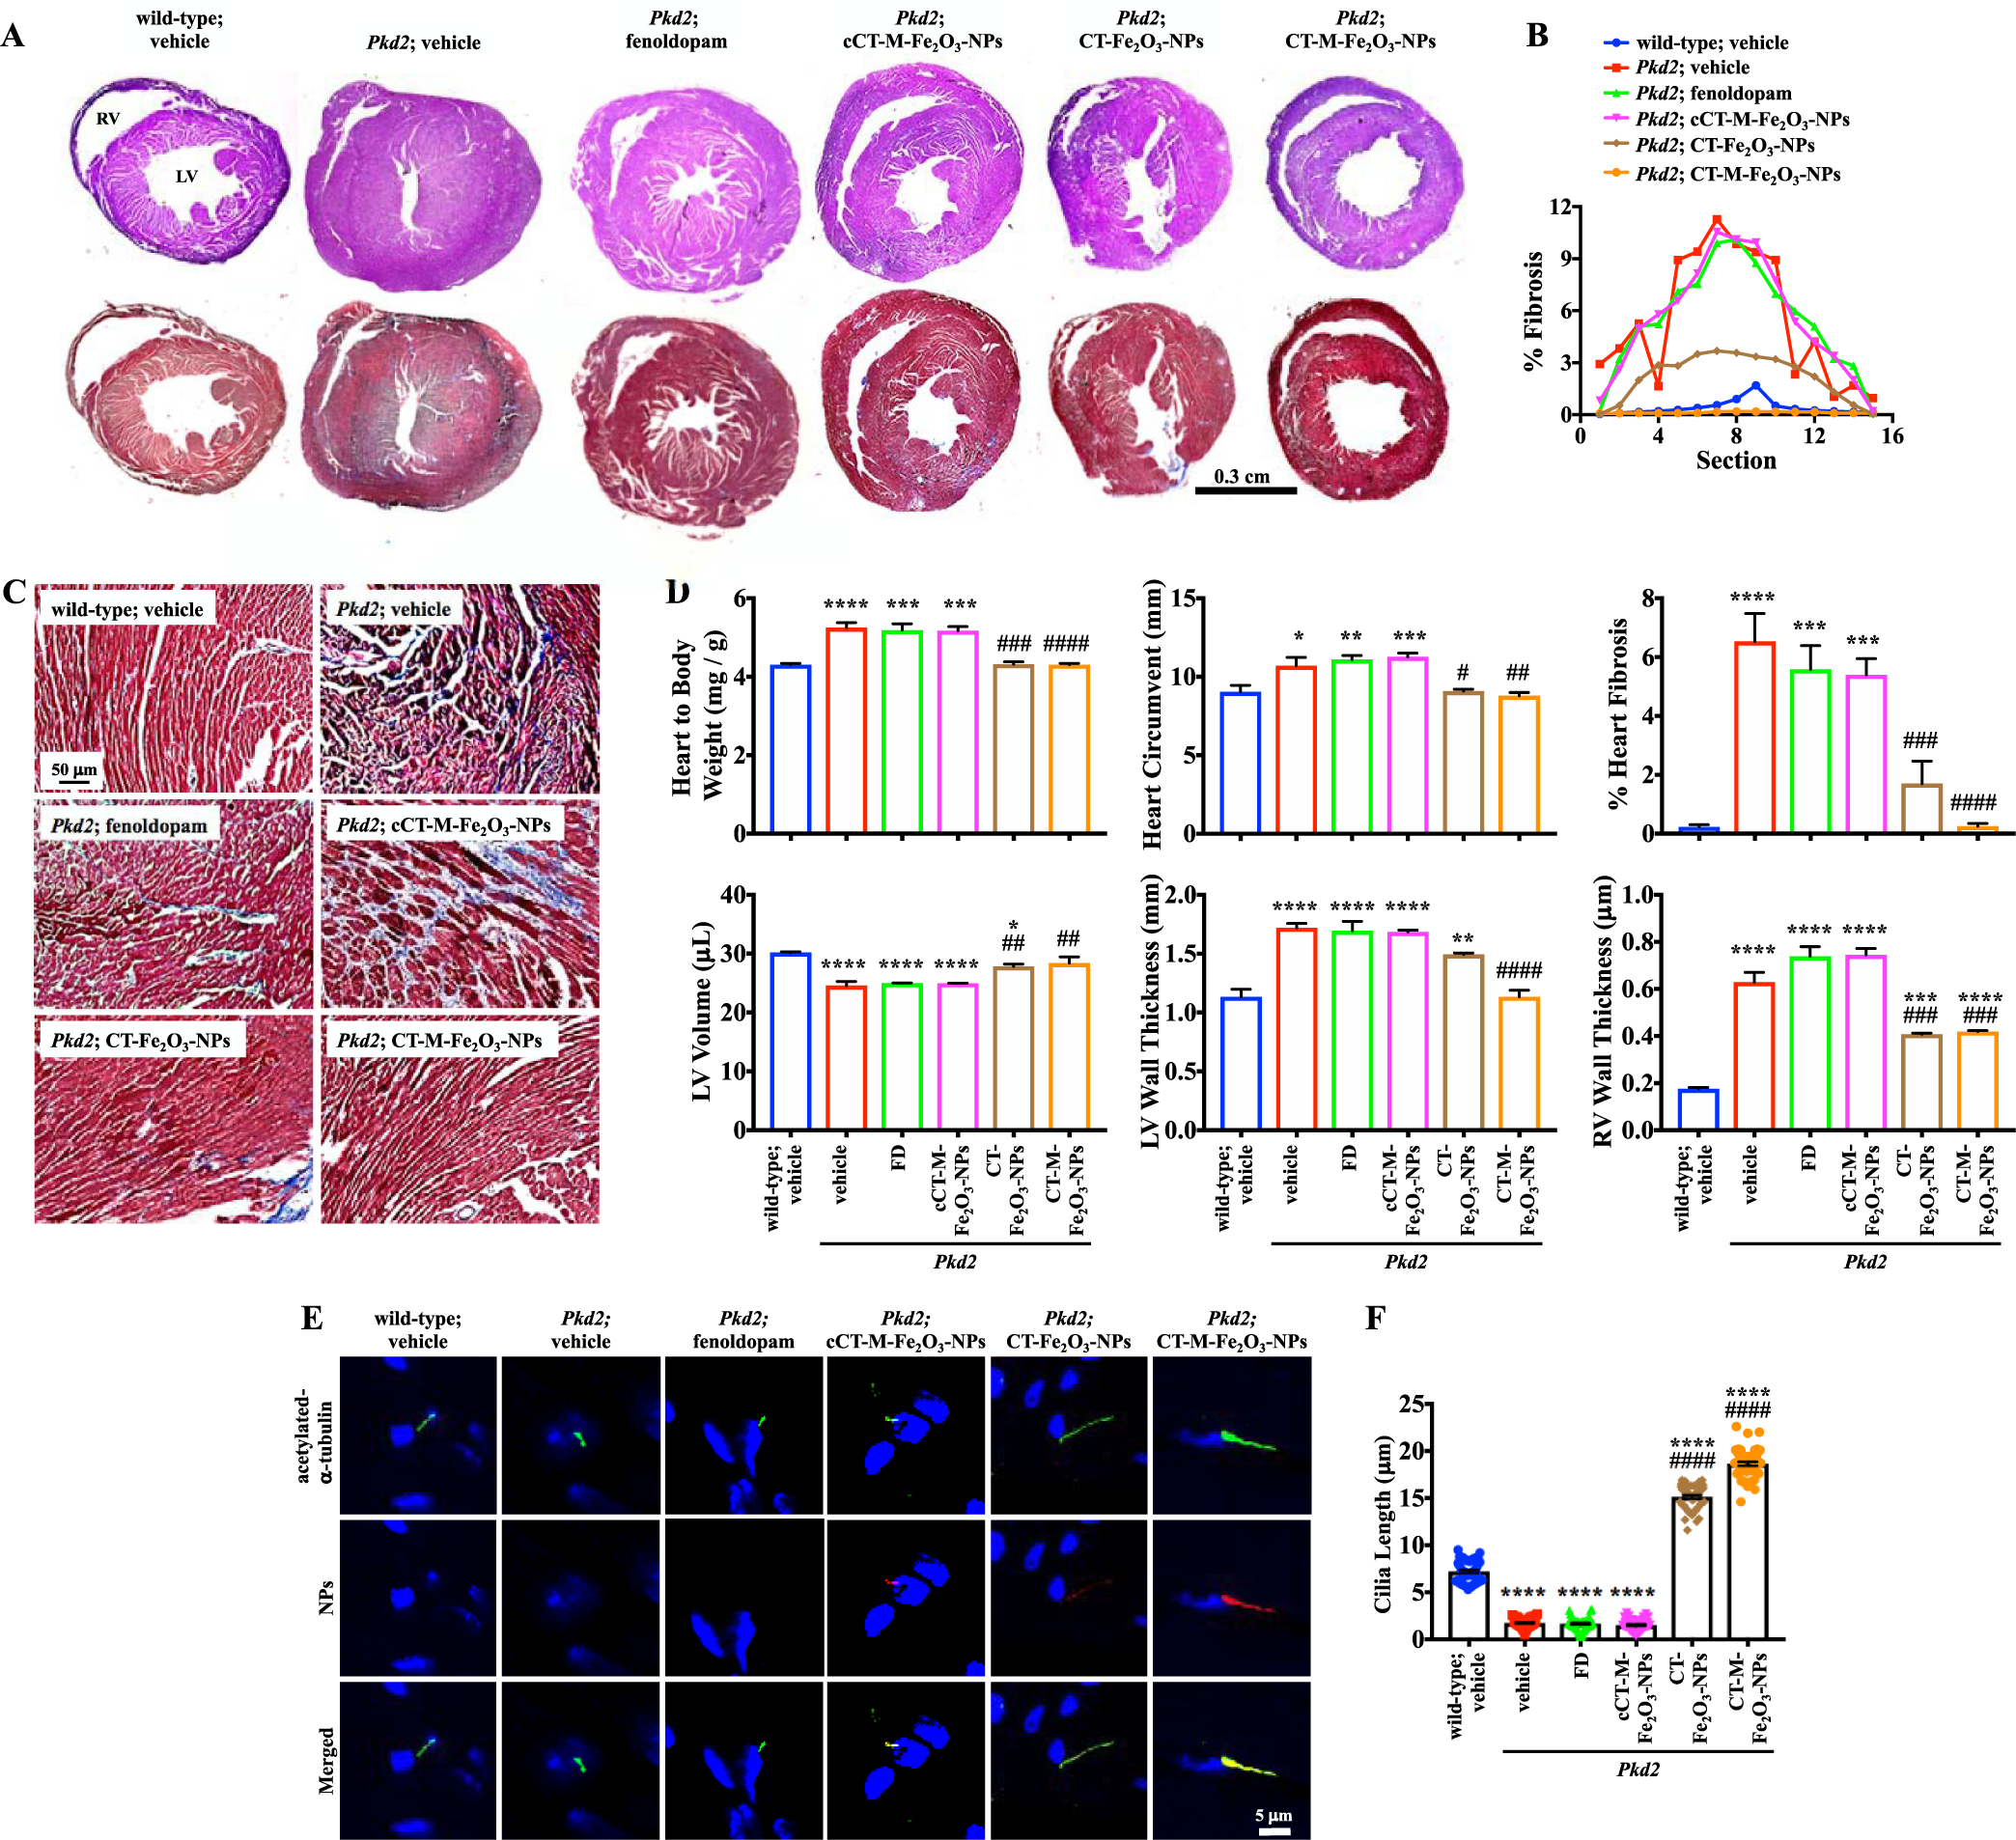
CT-Fe2O3-NPs increase the cilia length in Tie2Cre•Pkd2flox/flox mice and improve hypertrophy. (A) Sequential cross-sections of the same heart were used for H&E (top panel) and Masson’s trichrome (bottom panel) staining. With the exception of the muscle size, explicit differences in the morphology of the tissue were not observed using H&E staining. Fibrosis was evident in Masson’s trichrome-stained sections. RV = right ventricle; LV = left ventricle. (B) In the analyses of the sequential sections, the percent fibrosis was calculated from the fibrotic area per total cross-sectional area. (C) Masson’s trichrome staining of the left ventricle shows myocytes in red and collagenous fibrotic tissue in blue. (D) Heart parameters were calculated to determine changes in the physical characteristics of the hearts. (E) Localization of the NPs and length of cilia in myocytes were examined. (F) Cilia length is presented in the dot-plotted bar graphs. For all immunofluorescence studies, green represents acetylated-α-tubulin (cilia marker), red represents NPs, and blue represents DAPI (nucleus); N = 5 mice per group in each study, except for working heart studies (N = 3 mice per group); *, p < 0.05; **, p < 0.01; ***, p < 0.001; and ****, p < 0.0001 compared with the wild-type mice. #, p < 0.05; ##, p < 0.01; ###, p < 0.001; and ####, p < 0.0001 compared with the Pkd2 mice.