
Figure 7.
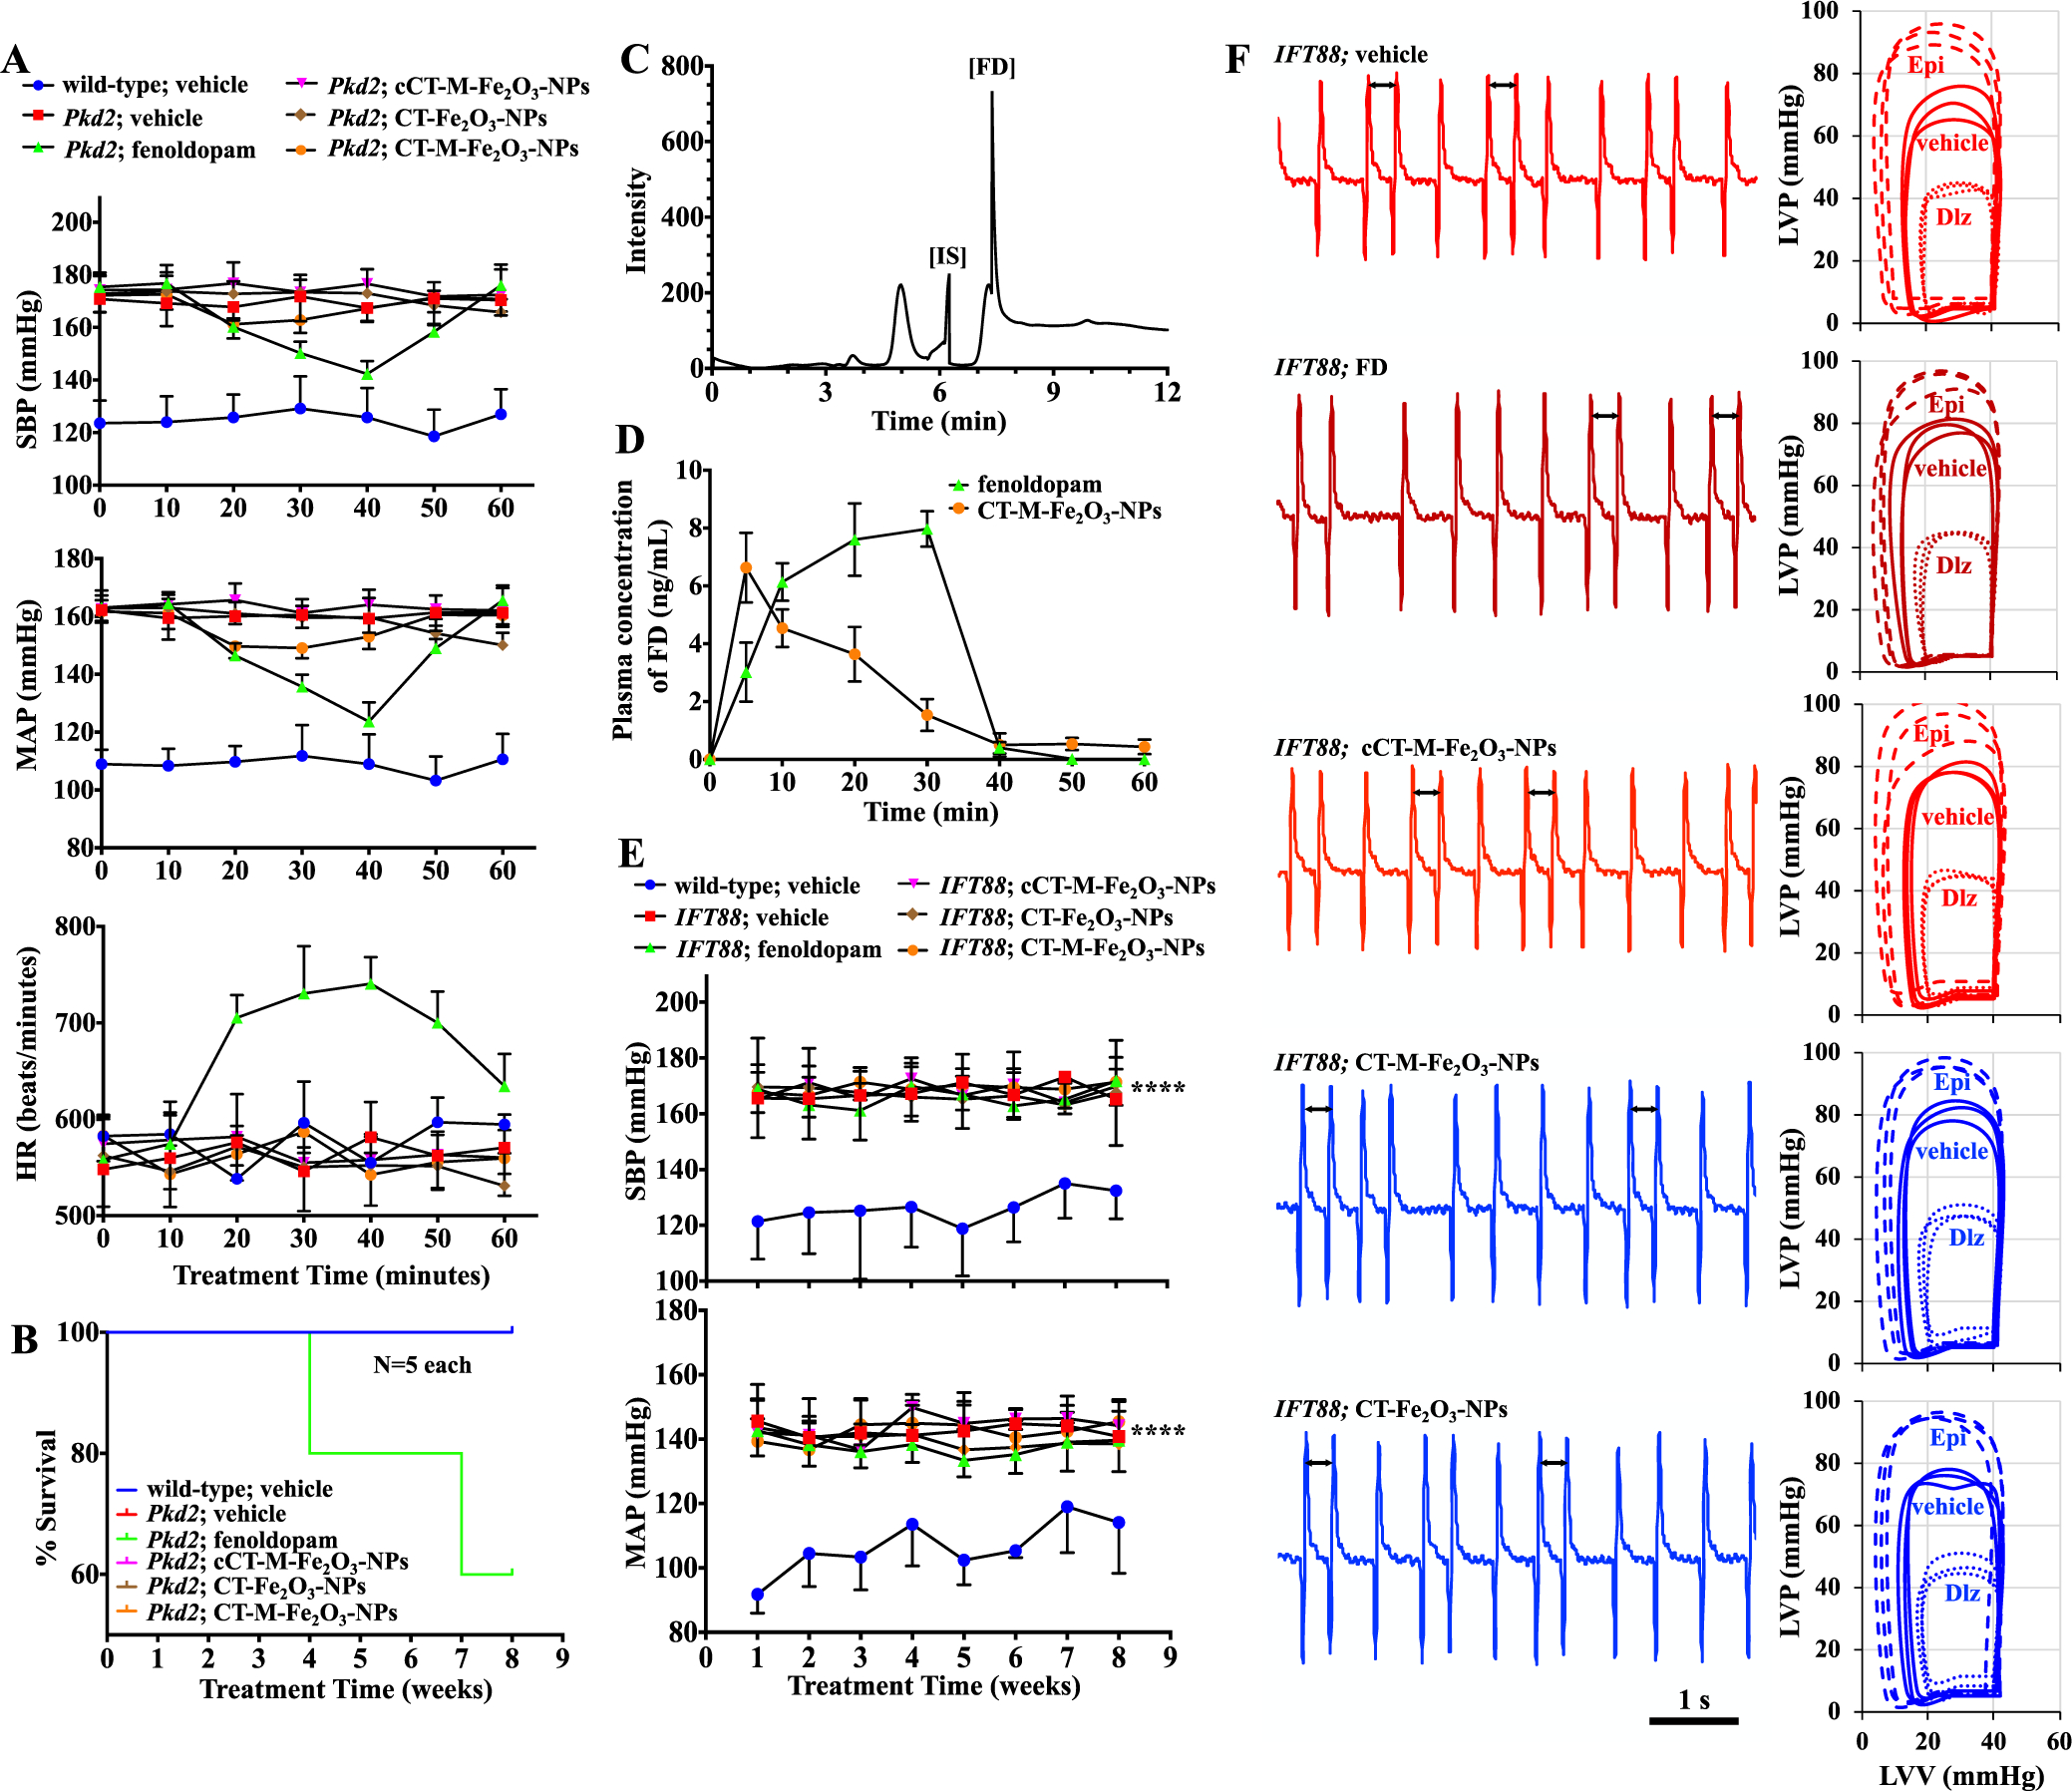
Validating effects of fenoldopam and CT-Fe2O3-NPs on cardiovascular functions. (A) Blood pressure was measured for 60 min. SBP, MAP, and heart rate (HR) are shown in the line graphs. (B) Survival curves for Pkd2 mice receiving different treatments for 8 weeks; mice that received repeated fenoldopam infusions only showed 40% mortality. (C) HPLC chromatogram of plasma spiked with an internal standard (SKF-38393; IS) and fenoldopam (FD). (D) Plasma concentration–time curves present the mean plasma fenoldopam concentrations measured in mice (N = 3–5 animals) treated with the CT-M-Fe2O3-NPs or fenoldopam-alone. Fenoldopam was administered as a 1.0 μg/kg/min intravenous infusion for 30 min. (E) Blood pressure was measured in mice that received different treatments at the end of each week for 8 consecutive weeks. SBP and MAP are shown in the line graphs. (F) Representative ECG traces of the hearts over a 5 s duration. Arrows indicate uneven heart rhythms. The corresponding loop diagrams show the LVV and LVP relationship without (PBS or vehicle) and with stressors. Stress was achieved with either epinephrine (Epi; 4 μg/L for each mg of heart tissue) or diltiazem (Dlz; 0.08 μg/L for each mg of heart tissue). Unless indicated otherwise, N = 4 mice per group in Pkd2 study, N = 5 in IFT88 study; ****, p < 0.0001 compared with the wild-type mice (without Cre activation).