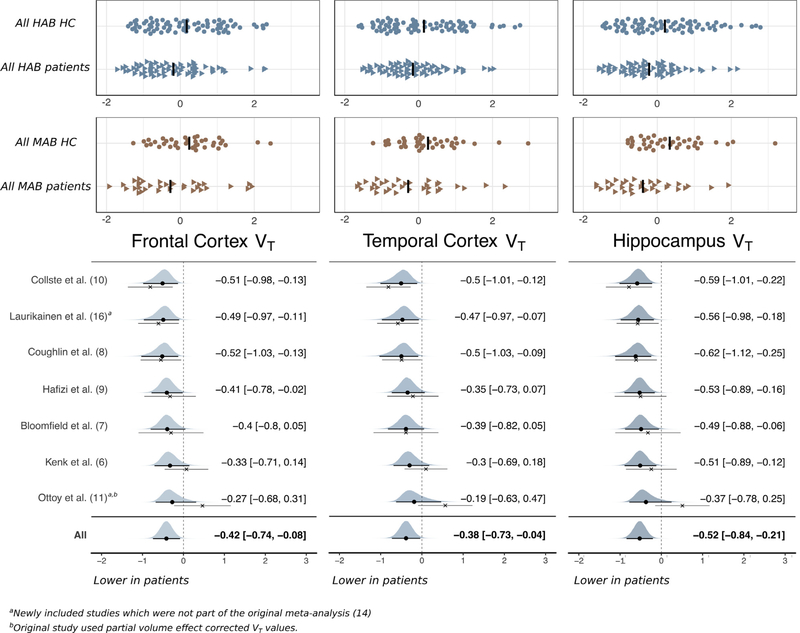
Figure 1.
Standardized differences in VT between patients with psychosis and HC subjects. The top panel shows the TSPO VT values of all individual patients and HC subjects, subdivided into HAB and MAB groups, respectively. The data have been standardized within genotype and study with a mean of 0 and an SD of 1, in order to allow for visualization of compiled data obtained using different radioligands. The lower panel shows the estimated standardized difference in VT using a Bayesian linear effects model, with study as random effect. The black circle denotes the posterior mean, and the thick line denotes the 95% credible interval of the estimated random slopes (study specific effects); these are also presented in text next to the plots. The cross denotes the patient–control subject mean difference in raw data (together with its 95% confidence interval) without performing linear mixed-effects modeling. Hence, the difference between the dot and the cross displays the model shrinkage toward the mean. HAB, high-affinity binder; HC, healthy control; MAB, mixed-affinity binder; TSPO, 18-kDa translocator protein; VT, total distribution volume.

