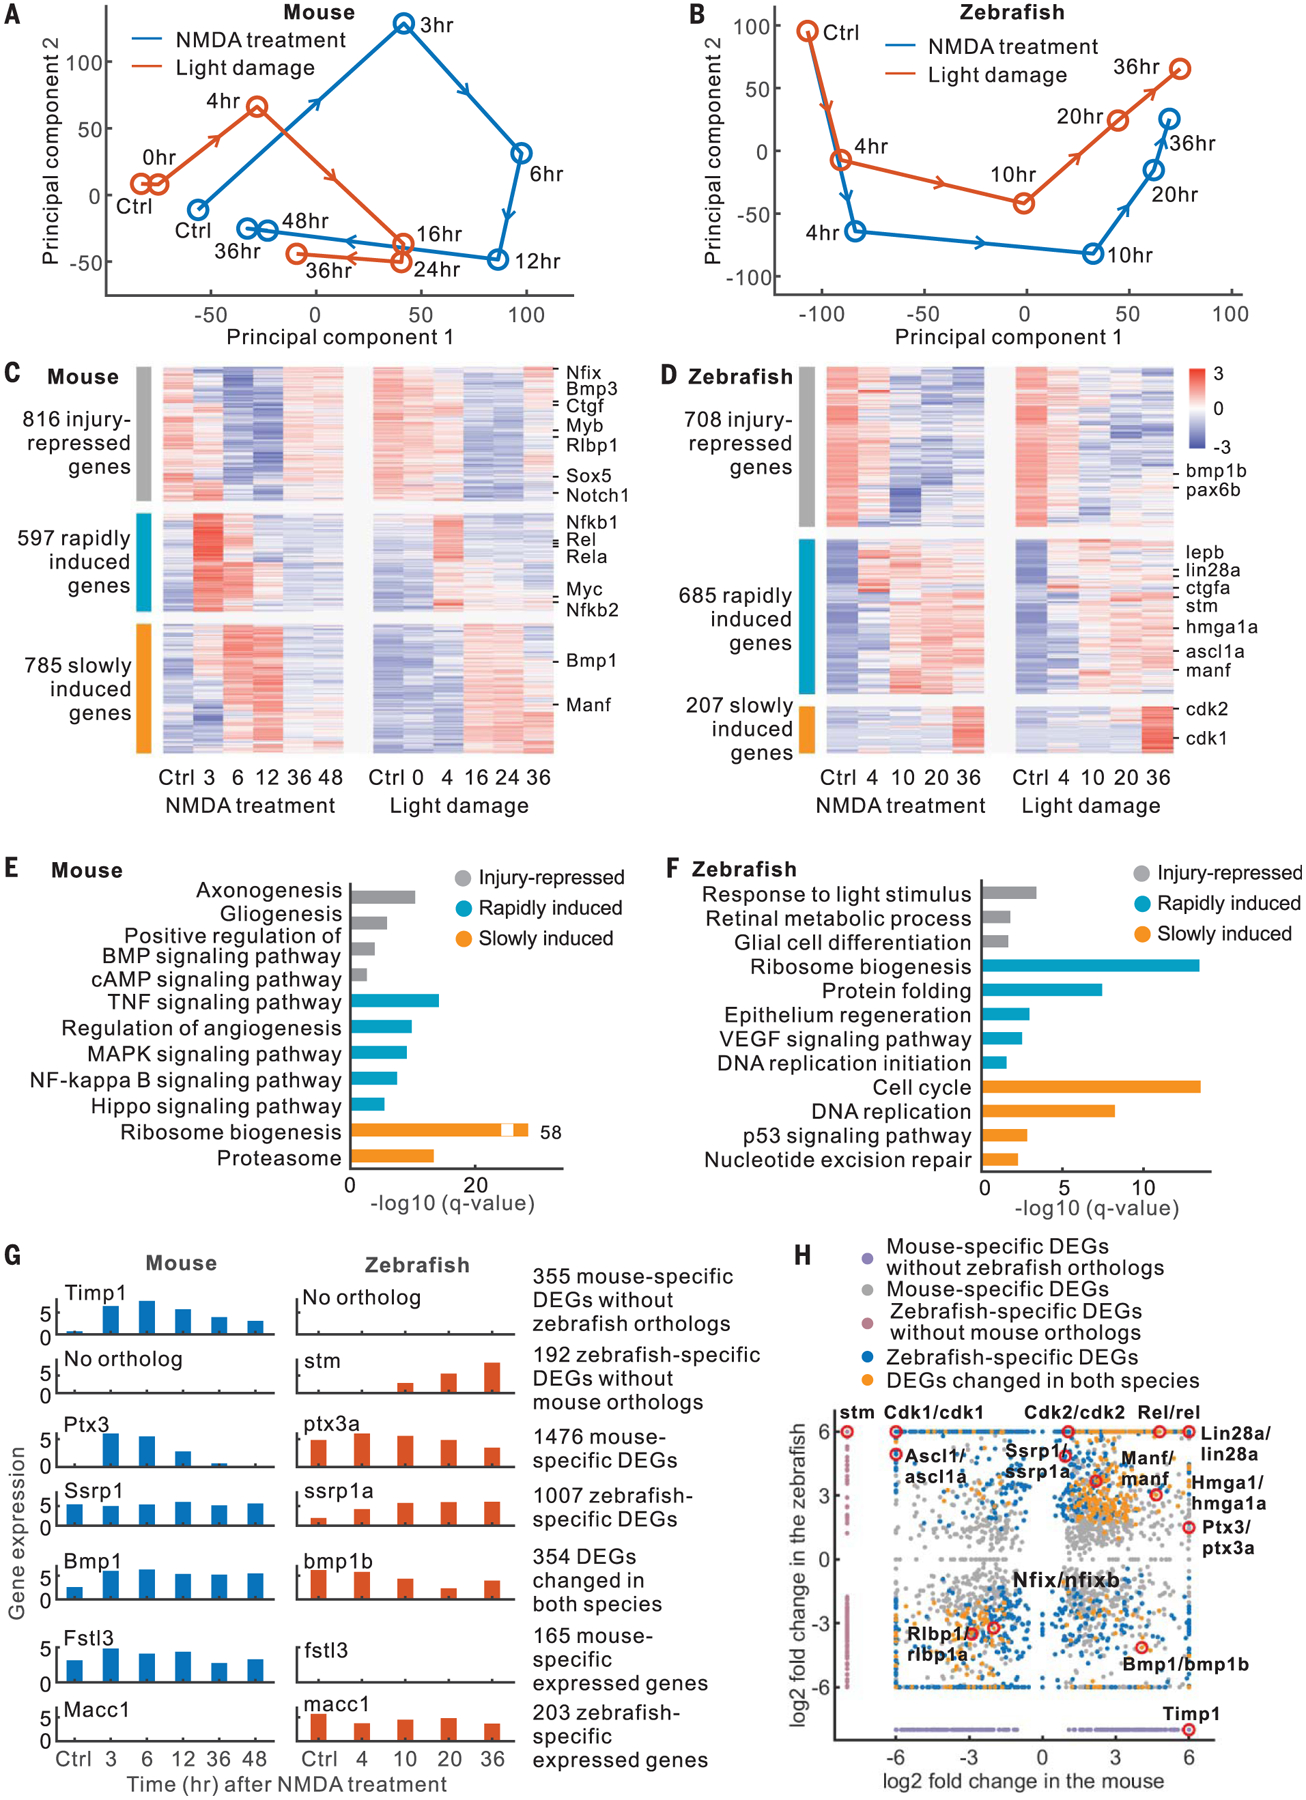
Fig. 1. RNA-seq analysis of mouse and zebrafish Müller glia.

(A and B) Principal component analysis of RNA-seq data. (C and D) Expression profiles of DEGs. (E and F) Enriched functions of DEGs. BMP, bone morphogenetic protein; cAMP, cyclic adenosine monophosphate; VEGF, vascular endothelial growth factor. (G) Examples of DEGs and species-specific expressed genes. (H) Comparison of DEGs between mouse and zebrafish.
