
Figure 4.
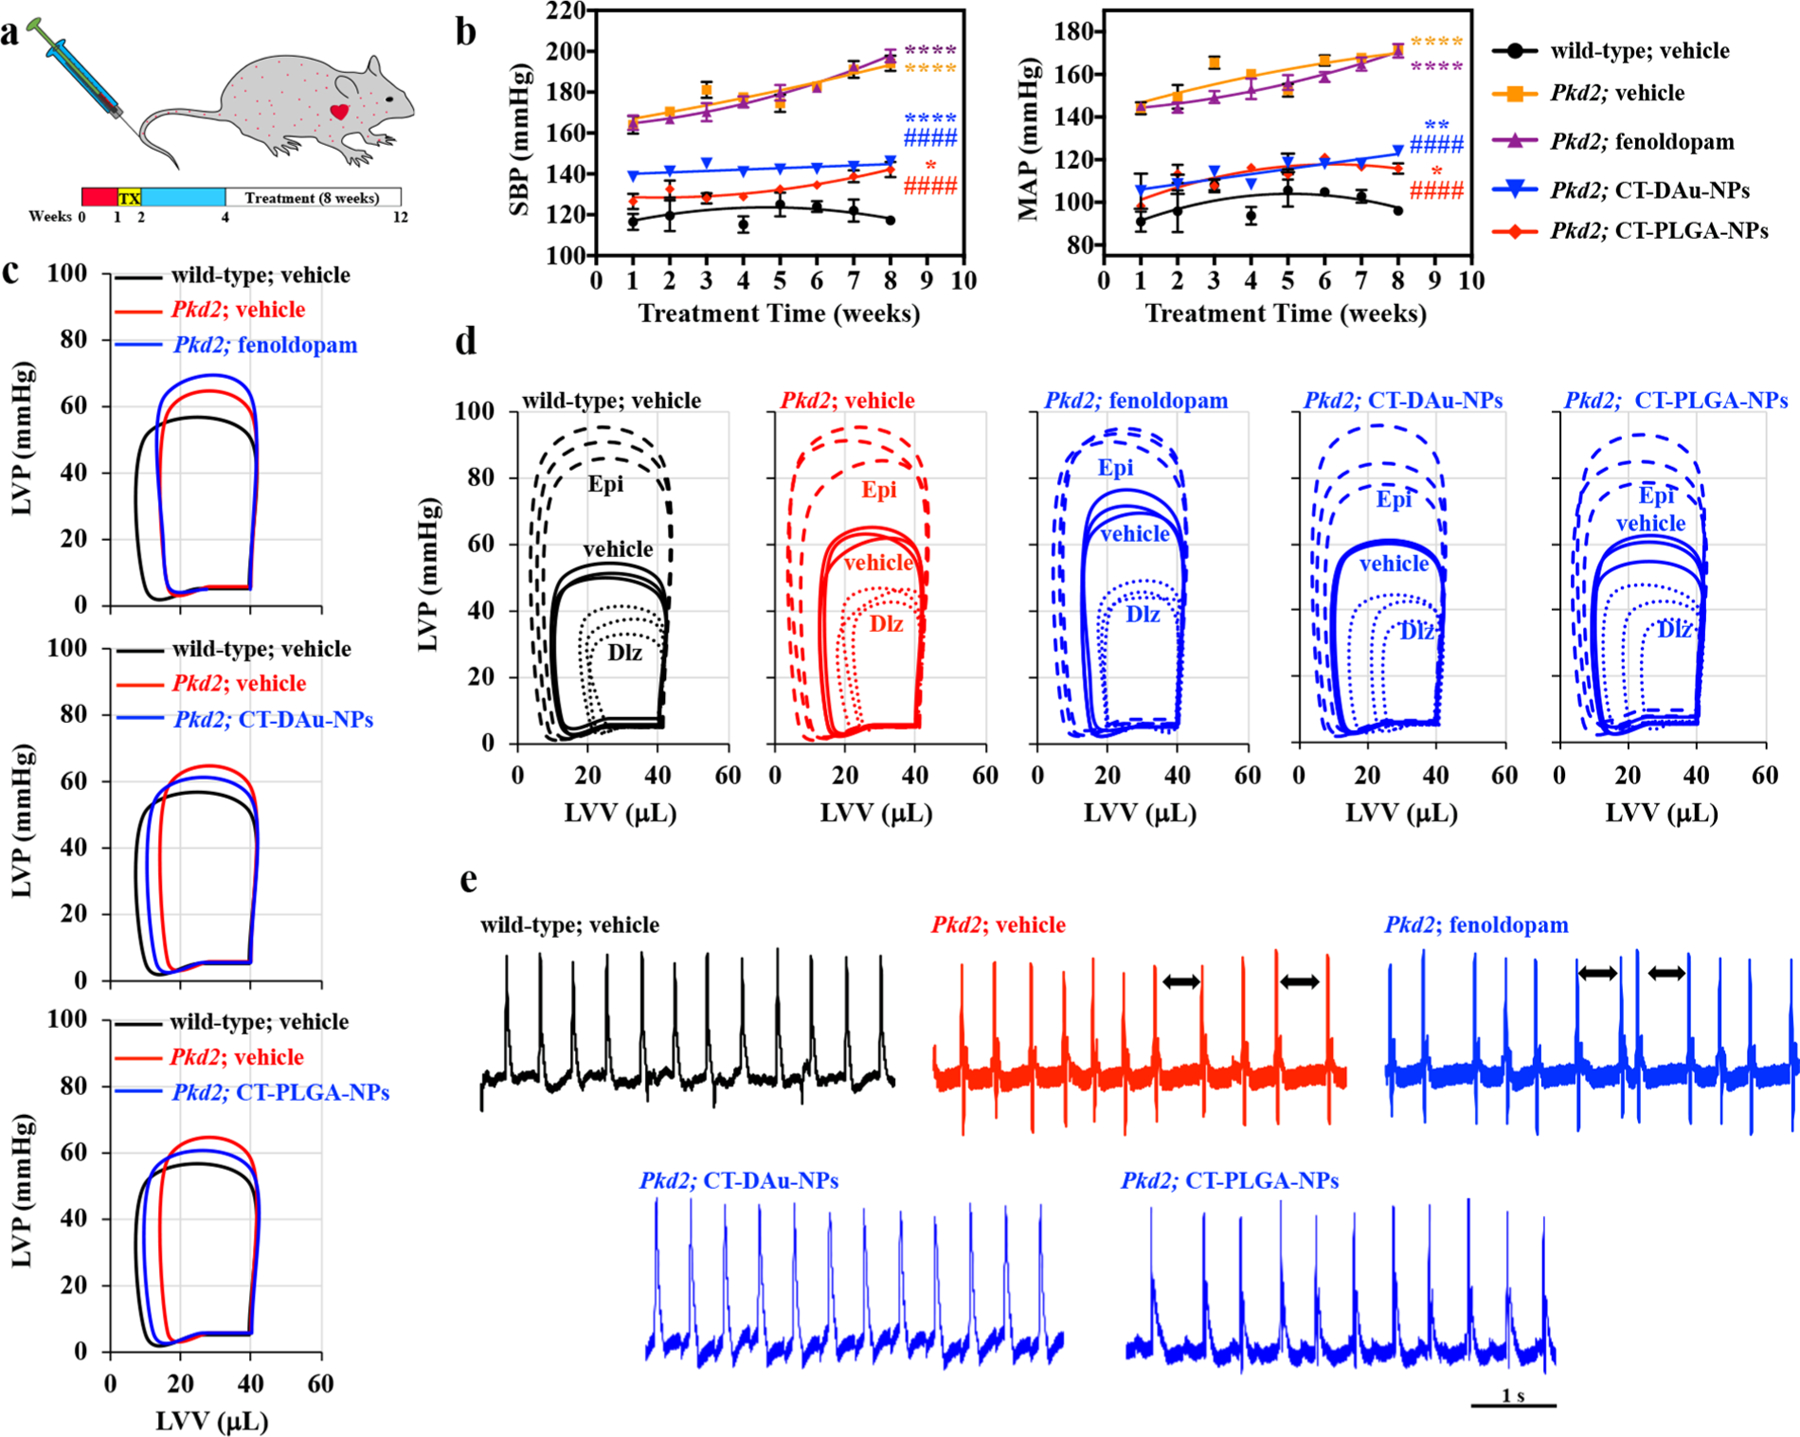
Treatment of hypertensive Pkd2 mouse model. (a) Scheme showing timeline for mutation induction and different treatment regimens. TX, tamoxifen. (b) Representative line graphs showing the changes in systolic (SBP) and mean arterial (MAP) blood pressures for 8 weeks. (c) Representative left ventricular pressure-volume (P-V) loops for control, fenoldopam, CT-DAu-NPs, and CT-PLGA-NPs. (d) P-V loops showing the stress response when treated with negative (diltiazem) or positive (epinephrine) chronotropic agents in different treatment groups. (e) Measurements of hearts from control and different treatments of mice were performed using electrocardiograms (ECG). Arrows indicate abnormal spacing. n = 3 for all experiments. *p < 0.05, **p < 0.01, ***p < 0.001, ****p < 0.0001 compared to wild-type vehicle. #p < 0.05, ##p < 0.01, ###p < 0.001, ####p < 0.0001 compared to Pkd2 vehicle. Statistical analysis was performed using a second order quadratic polynomial goodness of fit followed with ANOVA using a Tukey’s multiple comparisons test.