
Figure 5.
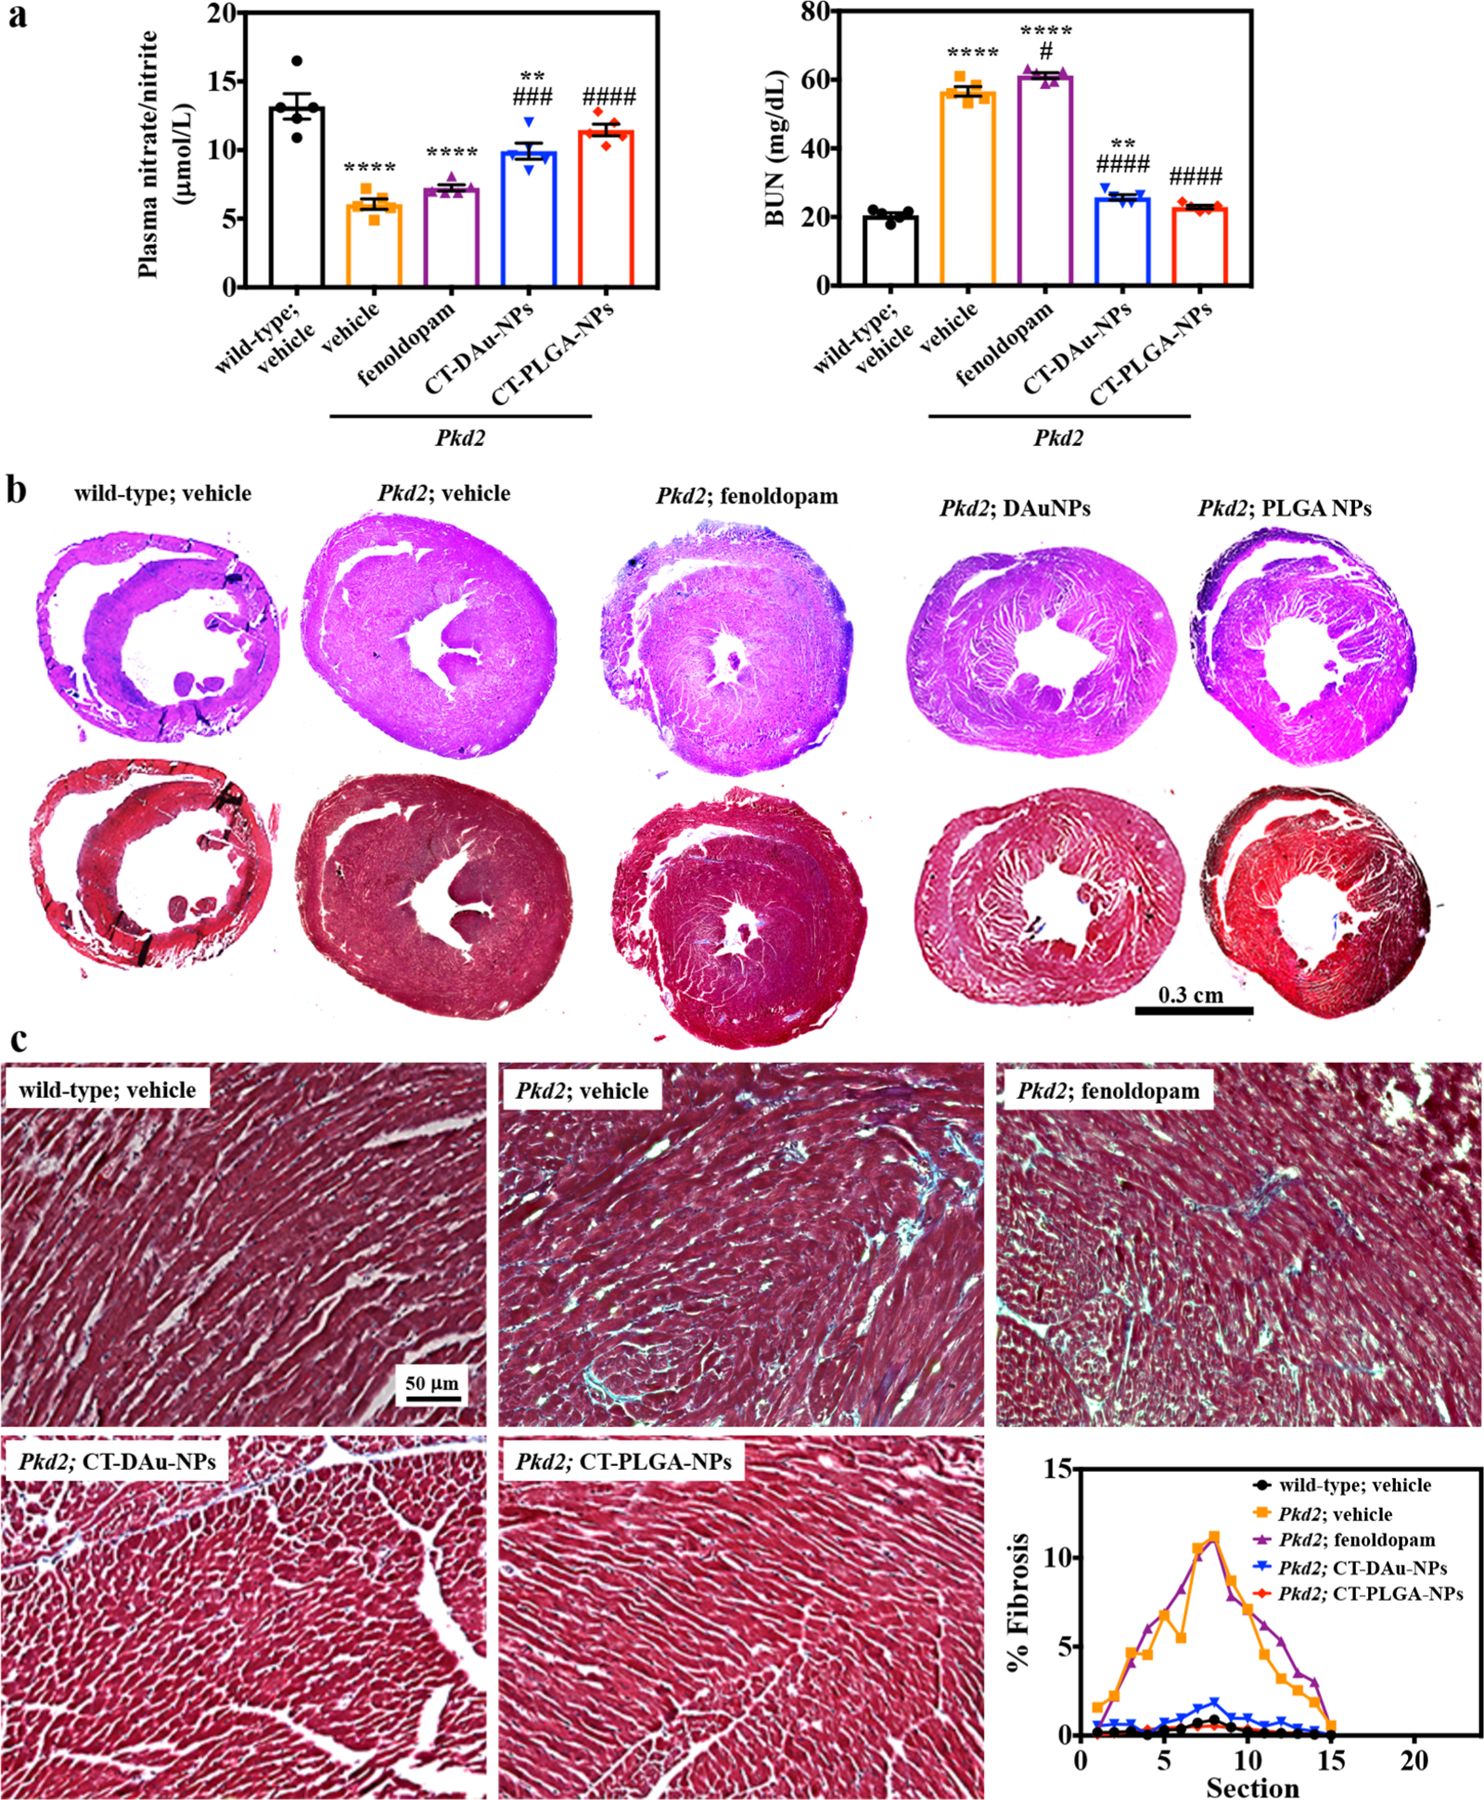
Improvement of biochemistry and heart phenotypes in Pkd2 mice model. (a) Nitrate/nitrite (NOx) and blood urea nitrogen (BUN) concentrations were measured. (b) To assess the heart hypertrophic effect, the thickness of the left ventricle was compared in whole-heart-cross sections using HE staining. Representative microscopic images of HE-stained sections of the left ventricle (LV), showing disparate pathological changes with different treatments. Representative microscopic images of Masson-trichrome-stained sections of LV; myocytes, stained red; collagenous tissue, stained blue. (c) Representative zoomed microscopic images of Masson-trichrome-stained sections of LV showing the amount of fibrosis, which is indicated as blue color. Representative line graphs showing the % of fibrosis in different treatment hearts. n = 3 for all experiments if not represented in dot plot. * p < 0.05, **p < 0.01, ***p < 0.001, ****p < 0.0001 compared to wild-type vehicle. #p < 0.05, ##p <0.01, ###p < 0.001, ####p < 0.0001 compared to Pkd2 vehicle. Statistical analysis was performed using ANOVA followed by a Bonferroni post hoc test.