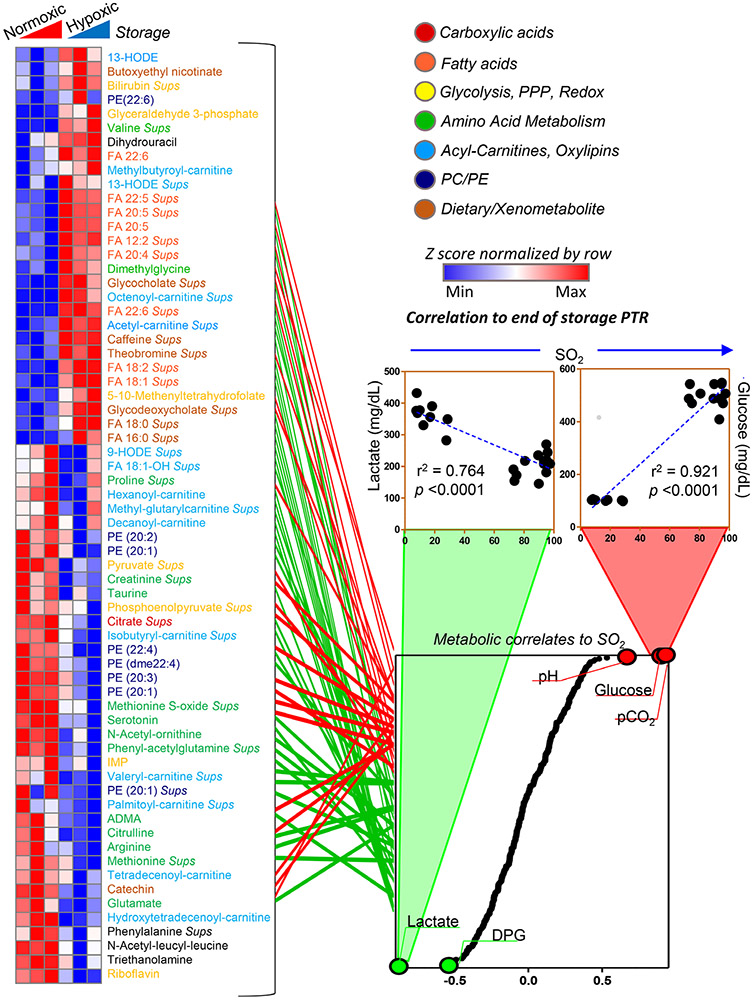
Fig. 4.
Significant metabolic correlates to PTR differ in a storage-independent hypoxia-dependent fashion, as noted in the heat map on the left-hand side. Metabolites are color coded by metabolic pathway, according to the legend in the top right corner. Some metabolites showed significant (module of Spearman) correlation to PTR in normoxia, but not in hypoxia at any given storage day and vice versa (red in heat map). Some of the metabolites with high correlation with PTR in normoxia were only significant in hypoxic RBCs at the end of storage. All these metabolites were part of pathways significantly affected by SO2 levels of the unit. Indeed, the levels of these metabolites showed significant positive (bottom right panel in red) or negative (green) correlations to SO2 levels. Correlation curves are shown for glucose and lactate, two representative metabolites of glycolysis and the most differentially regulated pathway between normoxic and hypoxic RBCs.

