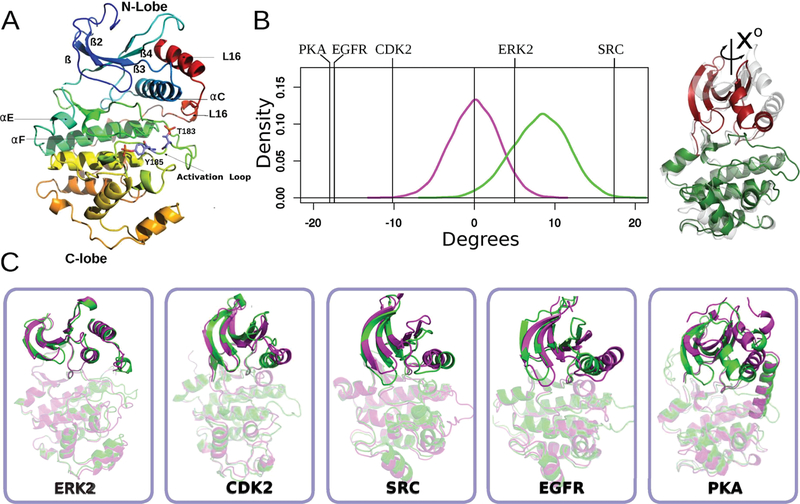
Figure 1.
Activation promotes conformational changes in helix-C and the N-terminal lobe. (A) Cartoon representation of the structure of active ERK2. Color changes from blue (N-terminal) to red (C-terminal). Secondary structures elements are labeled accordingly. (B) Kernel density estimation of the N-lobe to C-lobe rotational angle of the ERK2 taken from 1 μs long MD simulations (inactive shown in magenta, active in green). Vertical lines correspond to the change in the angle observed for the crystallographic structures of different kinases, the sign represents the direction of rotation of the active conformer respect to the inactive form. (C) Inactive (magenta) and active (green) conformations of five different kinases are shown (after C-lobe alignment) in order to illustrate the structural changes of the C-helix and N-terminal lobes.

