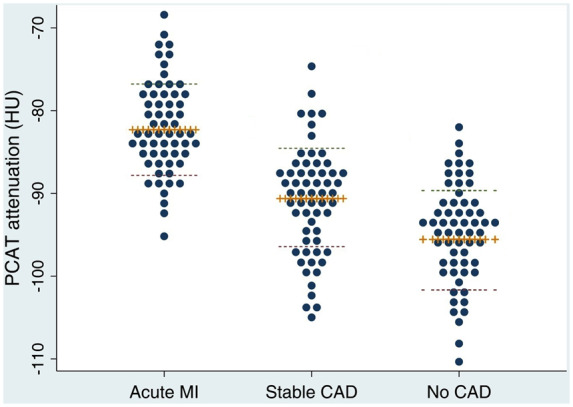
Figure 3.

Dot plots of PCAT attenuation values in different stages of CAD. Plus sign markers and dashed lines represent the mean and standard deviation, respectively. PCAT attenuation was higher in patients with MI (−82.3 ± 5.5 HU) compared with patients with stable CAD (−90.6 ± 5.7 HU, P < 0.001) and controls with no CAD (−95.8 ± 6.2 HU, P < 0.001). PCAT attenuation was significantly increased in stable CAD patients over controls (P = 0.01).
