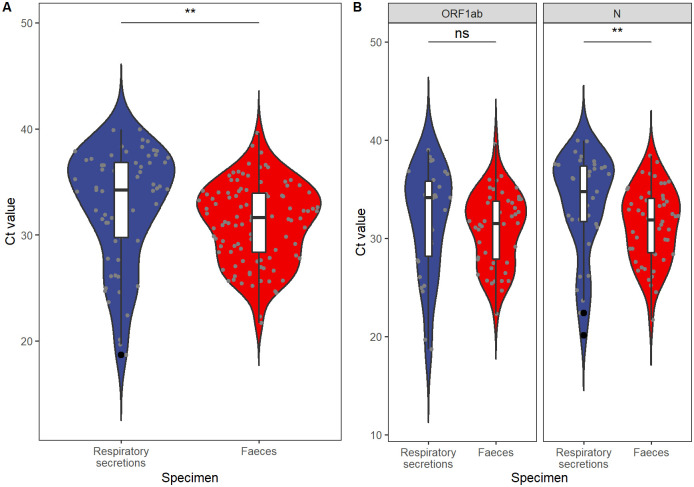
Fig 2. Differences in Cycle threshold (Ct) values between specimens of respiratory secretions and faeces in 10 independent cases.
The boxes and whiskers show the median, interquartile, and full range of Ct values. Boxes in blue represent respiratory secretions, and boxes in red represent faecal specimen. Jittered grey dots represent specimens with corresponding Ct values, and signs on the top illustrate statistical significance. **, statistically significant on level of 0.001<P<0.01; ns, P>0.05. A, Overall comparison with Ct values in both the ORF1ab and N regions. With P = 0.002 analysed by Wilcoxon rank-sum test, the Ct value of faecal samples is lower than that of respiratory secretions; hence, the viral load is higher in faecal specimens than in respiratory secretions. B, Comparison for each individual targeted region of SARS-CoV-2. With P = 0.006 analysed using Wilcoxon rank sum test, the Ct value of faecal specimens is lower than that of respiratory secretions for the N region.

