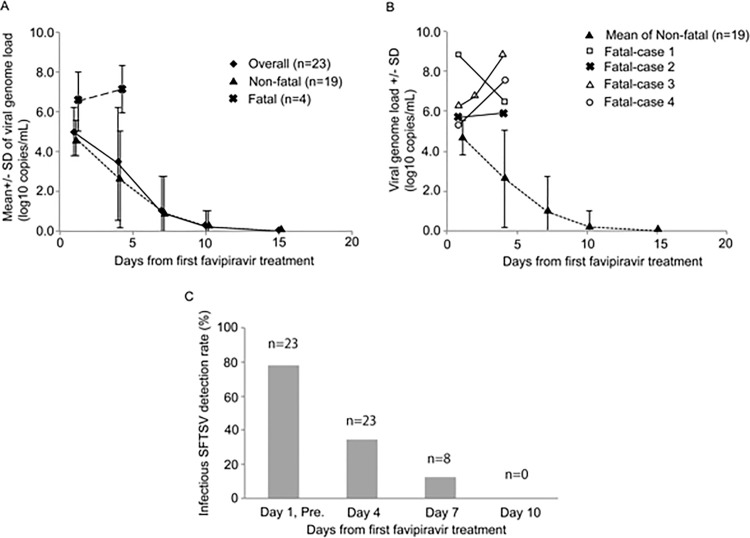
Fig 3. Transition in the amount of SFTSV in overall patients, the Non-fatal group, and Fatal group.
Transition in the amount of SFTSV in overall patients, the Non-fatal group, and Fatal group as determined by real-time RT-PCR is shown (A). The genome levels in each patient who died of SFTS are also plotted as well as those of the Non-fatal group (B). The SFTSV survival rate in terms of the isolation test for SFTSV is shown (C). “n” indicates the number of serum samples tested for virus isolation. When a serum sample became negative for SFTSV genome with qRT-PCR in one patient, the serum samples collected from the patients after the day on which it became SFTSV genome negative were not always subjected for virus isolation. Therefore, the numbers of serum samples subjected for virus isolation collected on Day 1, Day 4, Day 7, and Day 10 became 23, 23, 8, and 3, respectively. The rates of positive virus isolation were 78% (18/23), 35% (8/23), 12% (1/8), and 0% (0/3) on Day 1 and pre-dose (pre.), Day 4, Day 7, and Day10, respectively.

