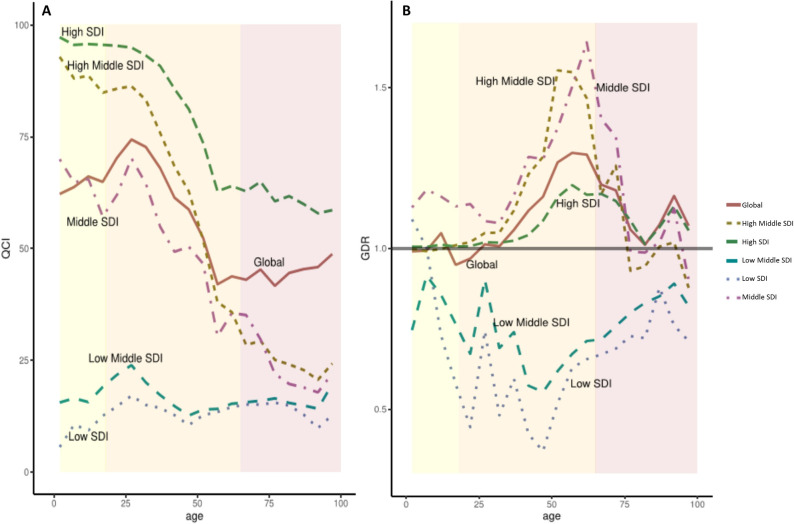
Fig 2. Disparity patterns in global and socio-demographic index (SDI) quintile regions.
A) Age disparity regarding access to health services estimated from the Quality of Care Index (QCI). B) Gender disparity ratio (GDR) in different age groups. Yellow: childhood and adolescence group, aging less than or equal to 18. Orange: adulthood group, ages between 18 and 65. Pink: elderly group, ages more than 65.

