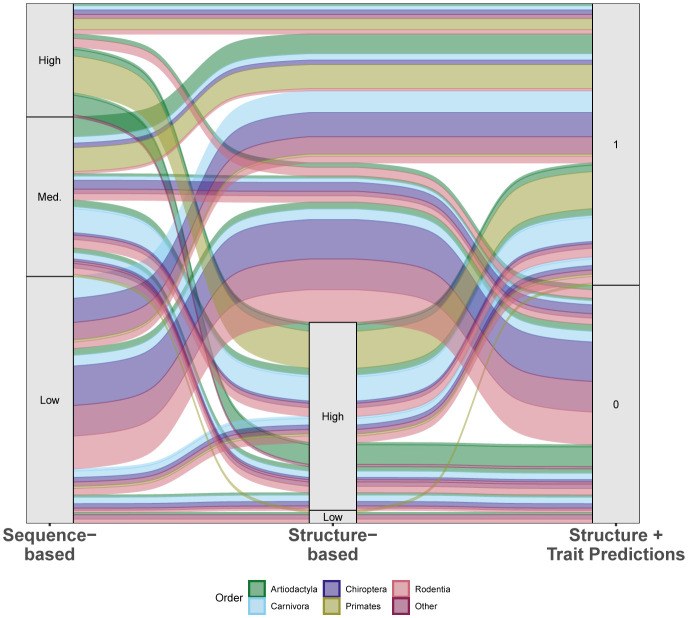
Figure 5.
An alluvial plot comparing predictions of species susceptibility from multiple methods. Existing studies (listed in supplementary file 1 Methods) are categorized as either sequence-based or structure-based. Predictions from our zoonotic capacity model result from combining structure-based modeling of viral binding with organismal traits using machine learning to distinguish species with zoonotic capacity above (1) or below (0) a conservative threshold value set by domestic cats (Felis catus). Colors represent unique mammalian orders, and the width of colored bands representing the relative number of species with that combination of predictions across methods. See supplementary file 1 methods for details on how species across multiple studies were assigned to categories (high, medium, low).

