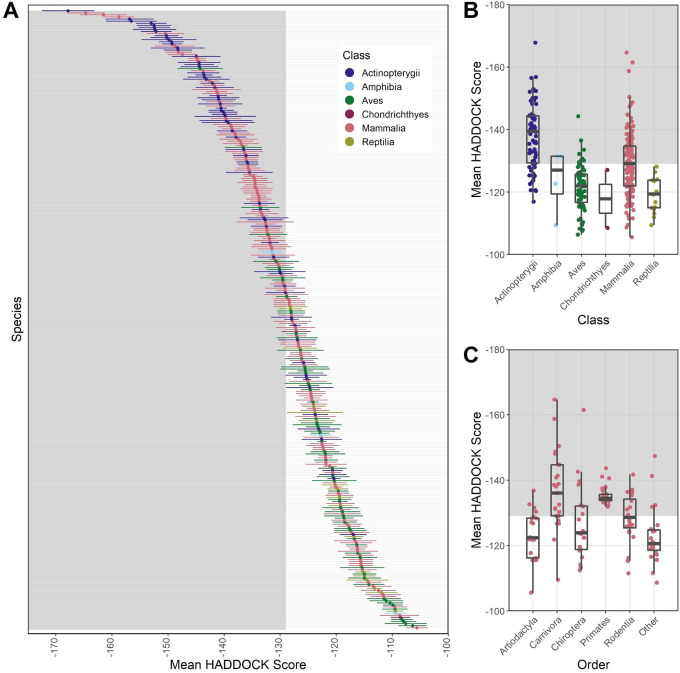
Figure 3.
Plots showing results from modeling species’ ACE2 interaction with SARS-CoV-2 RBD using HADDOCK to predict binding strength (measured as arbitrary units). HADDOCK scores that predict stronger binding are more negative. The mean and standard deviation of the HADDOCK score for vertebrate species (A) for which ACE2 orthologs are available. Binding strengths vary across vertebrate classes (B) and across the five most speciose mammalian orders (C). The “Other” category contains species across multiple orders for which ACE2 sequences were available, each with fewer than 10 representative species in the order. The shaded regions of all panels represent predicted binding that is as strong or stronger than (more negative values than) the domestic cat (Felis catus), which represents our conservative zoonotic capacity threshold based on currently available empirical evidence.

