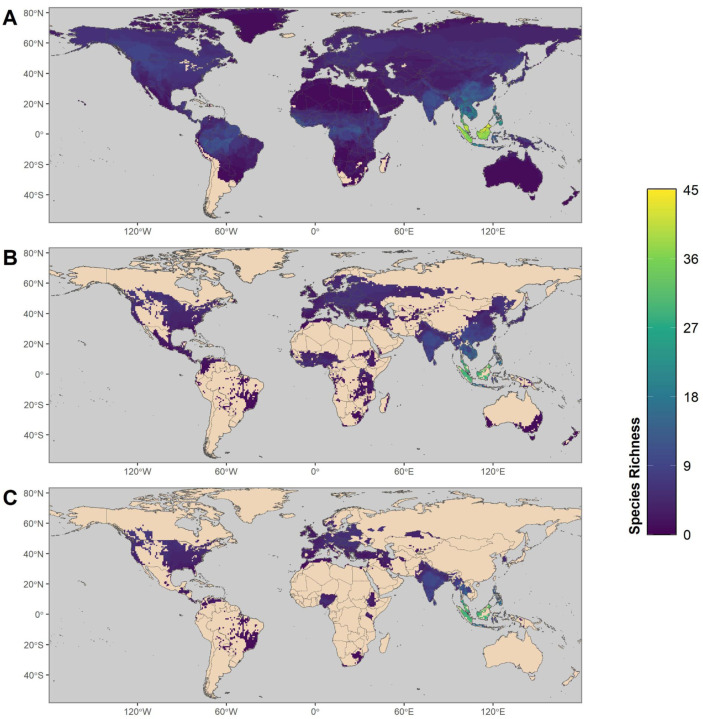
Figure 6:
Maps showing the global distribution of species with predicted capacity to transmit SARS-CoV-2. (A) depicts global species richness of the top 10 percent of model-predicted zoonotic capacity. Geographic ranges of this subset of species were filtered to those associated with human-dominated or human-altered habitats (B), and further filtered to show the subset of species that overlaps with areas of high human SARS-CoV-2 positive case counts (over 100,000 cumulative cases as of 17 May 2021) (C). For a full list of model-predicted zoonotic capacity of species by country, see Supplementary File 2 (https://doi.org/10.25390/caryinstitute.c.5293339).

