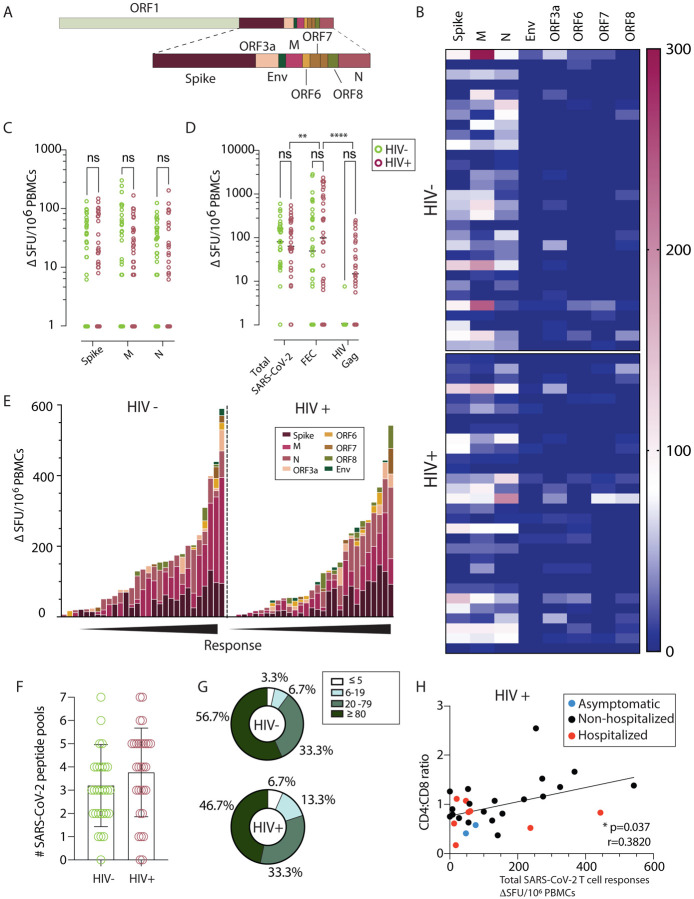
Fig. 2. Similar SARS-CoV-2 specific T cell responses by IFN-γ-ELISpot in HIV positive and negative donors.
(A) Genome organization of SARS-CoV-2 (B) Dominance of the IFN-γ-ELISpot responses. Heatmap depicting the magnitude of the IFN-γ-ELISpot responses to the different SARS-CoV-2 peptide pools in HIV negative and HIV positive individuals. (n=30 in each group) (C) Magnitude of the IFN-γ-ELISpot responses. IFN-γ SFU/106 PBMCs are shown for SARS-CoV-2 Spike (S), Membrane (M) and Nucleocapsid (N) between HIV negative (green) and HIV positive (red). (n=30 per group). (D) Magnitude of the IFN-γ-ELISpot responses for Total SARS-CoV-2 responses (S, M, N, ORF3a, ORF6, ORF7, ORF8 and Env), FEC and HIV Gag between HIV negative (green) and HIV positive (red). (n=30 per group). (E) Hierarchy of the IFN-γ-ELISpot responses. IFN-γ SFU/106 PBMCs responses in order of magnitude within each group with the contribution of the responses to a specific pool shown by color legend. (F) Diversity of the IFN-γ-ELISpot responses. Number of pools each of the donors has shown positive responses in the IFN-γ-ELISpot assay. The total of SARS-CoV-2 pools tested was 7. (G) Proportion of T cell response magnitude in the HIV negative and HIV positive individuals. (H) Correlation between CD4:CD8 ratio in HIV infected individuals with their total SARS-CoV-2 responses, depicting disease severity per each donor (Red dots: hospitalized cases; Black dots: non-hospitalized cases; blue dots: asymptomatic cases.). The non-parametric Spearman test was used for correlation analysis. Two-way ANOVA was used for groups comparison. *p < 0.05, **p<0.01.

