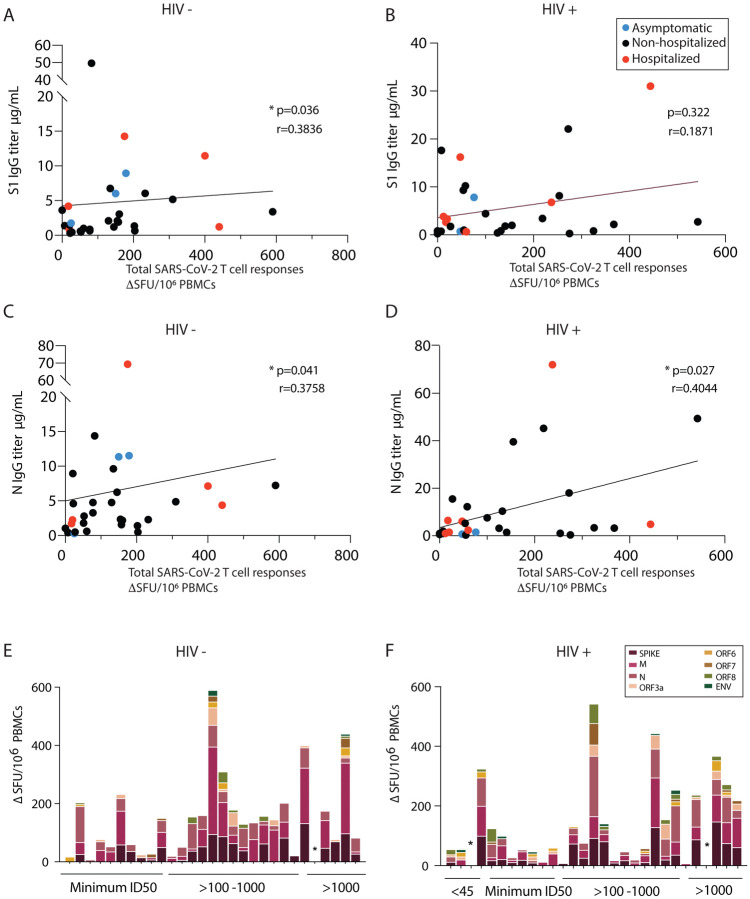
Fig. 3. Interrelations between T cell and antibody responses in HIV positive and negative donors.
(A) Correlation of total SARS-CoV-2 responses with S1 IgG titers in HIV negative and (B) HIV positive. (C) Correlation of total SARS-CoV-2 responses with N IgG titers in HIV negative and (D) HIV positive subjects. Red dots: hospitalized cases; Black dots: nonhospitalized cases. (E) Hierarchy of the T cell responses ordered by the neutralizing capacity by their antibody titers for HIV negative and (F) HIV positive donors. The non-parametric Spearman test was used for correlation analysis. *p < 0.05, **p<0.01

