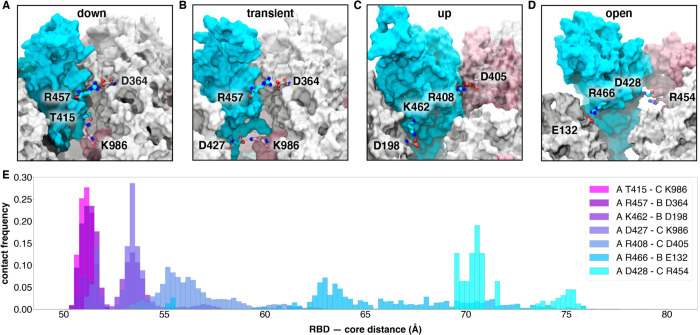
Figure 5.
Salt bridges and hydrogen bonds along the opening pathway. (A-D) salt bridge or hydrogen bond contacts made between RBD A, shown in blue, with RBD B, shown in gray, or RBD C shown in pink within the “down”, transient, “up”, and “open” conformations, respectively. (E) Histogram showing the frequency at which residues from (A-D) are within 3.5 Å of each other relative to RBD — core distance. Frequencies are normalized to 1.

