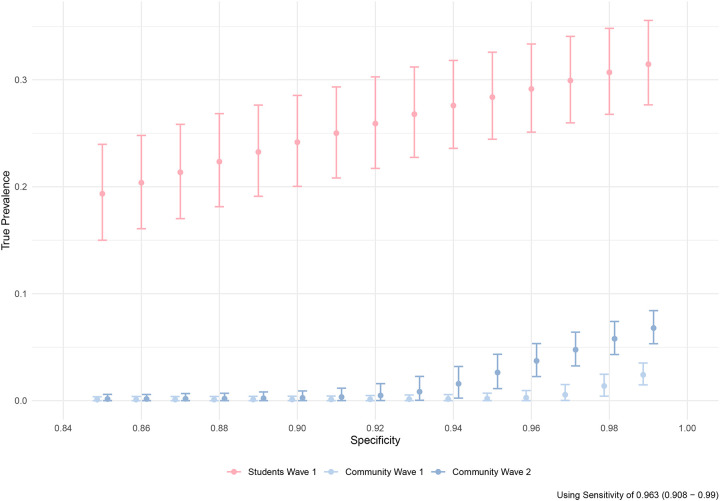
Figure 3:
Estimated true prevalence (circles, with 95% confidence intervals) among participants at each sampling interval corrected for estimated assay sensitivity as a function of the assumed assay specificity (x-axis). Light blue indicates community residents at the first visit at the start of the Fall 2020 term, red indicates returning students at the end of the Fall 2020 term, and dark blue indicates community residents at the second visit after student departure.

