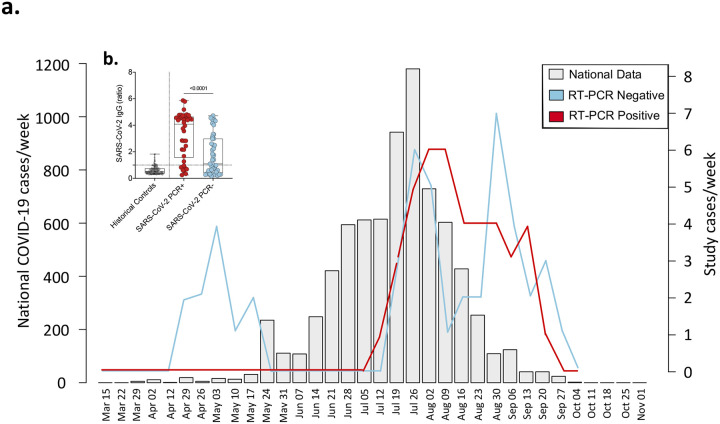
Figure 1. Study recruitment timeline and SARS-CoV-2 diagnosis.
a) Suspected and SARS-CoV-2 RT-qPCR confirmed COVID-19 patients recruited at Queen Elizabeth Central Hospital, Blantyre (positive (red) and negative (blue)) reported as cases/week compared to the national data (light gray). National data includes SARS-CoV-2 RT-qPCR confirmed symptomatic and non-symptomatic COVID-19. b) SARS-CoV-2 Spike protein 2 (S2) and nucleoprotein (NP) IgG antibodies in PCR-negative and positive individuals. Pre-pandemic historical samples (2016–2019) were tested for SARS-CoV-2 S2 and NP IgG antibodies. The data are reported as the ratio of OD in the test samples to the assay threshold control. The horizontal bars represent the median and interquartile range (IQR). Data were analysed using Kruskal-Wallis test (Historical samples, n=132; PCR-positive, n=38; PCR-negative, n=45). Severe acute respiratory syndrome coronavirus 2; COVID-19, coronavirus disease of 2019; PCR, polymerase chain reaction; IgG, immunoglobulin G; SARI, severe acute respiratory infection.

