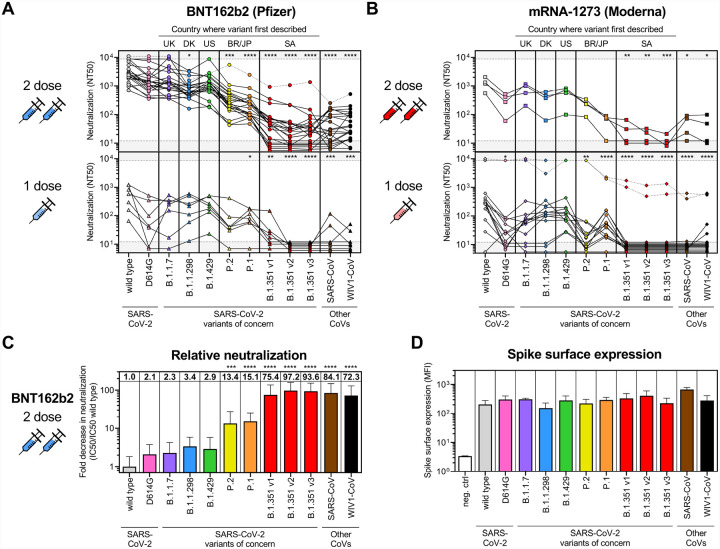
Figure 3: Sera from COVID-19 vaccine recipients cross-neutralize some but not all SARS-CoV-2 variants of concern.
(A-B) Titers that achieve 50% neutralization (NT50) are plotted for all individuals that received 1 dose (bottom panels) or 2 full doses (upper panels) of either the BNT-162b2 (A) or mRNA-1273 (B) vaccines for each of the following SARS-CoV-2 pseudoviruses: wild-type; D614G; B.1.1.7; B.1.1.298; B.1.429; P.2; P.1; and three variants of the B.1.351 lineage denoted as B.1.351 v1, v2, and v3. Other coronaviruses, namely, SARS-CoV from the 2002 Hong Kong outbreak and the pre-emergent bat coronavirus WIV1-CoV, were also tested. Individuals who were <7 days out from their second dose of the vaccine were classified as having received 1 dose. Dotted lines indicate vaccine recipients that were previously diagnosed with or highly suspected to have COVID-19 before being vaccinated. Gray regions indicate upper and lower limits of detection of our neutralization assay. The following abbreviations are used to indicate the country where the variant was first described: UK, United Kingdom; DK; Denmark; US, United States; BR, Brazil; JP, Japan; and SA, South Africa.
(C) Fold decrease in neutralization for each pseudovirus relative to wild type is shown for 22 vaccine recipients >7 days out from the second dose of BNT-162b2. Fold decrease was calculated by dividing the concentration at which 50% neutralization is achieved (IC50, which is 1/NT50) by the average IC50 value of wild type. The value of the mean is shown at the top of each bar. Bars and error bars indicate mean and standard deviation. An ANOVA correcting for multiple comparison between all pseudoviruses was performed, and statistical significance of each pseudovirus relative to wild type is shown with the following notations: * p < 0.05, ** p < 0.01, *** p < 0.001, **** p < 0.0001.
(D) Surface expression of the indicated variant spike proteins on the surface of transfected 293T cells was measured by flow cytometry. Transfected cells were stained with three monoclonal antibodies targeting spike, S309, ADI-55689, and ADI-56046, and median fluorescence intensities (MFI) of transfected (GFP+) cells were averaged to obtain a relative MFI demonstrating efficient expression of all spikes at the cell surface. Bars and error bars indicate mean and standard deviation.

