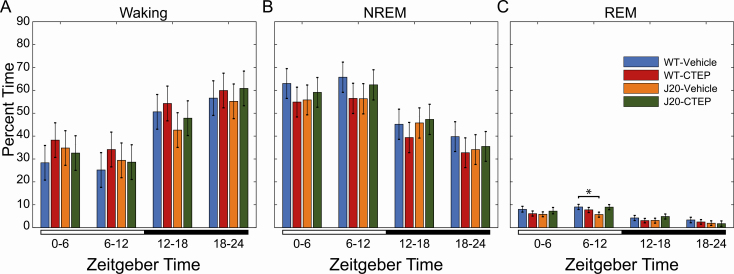
Figure 4.
Manually scored sleep based on EEG recordings from wild-type (WT) and J20 mice with and without CTEP. Data were separated into four 6-h bins, starting at Zeitgeber time zero, lights on. The lighting condition is annotated by the bar below the graphs: open: lights on and closed: lights off. Percent time in (A) waking, and (B) NREM and (C) REM sleep are presented as marginal means ± 95% confidence interval (95% CI) for each treatment group: WT treated with vehicle (n = 3 mice for 3 days, blue), WT treated with CTEP (2-chloro-4-((2,5-dimethyl-1-(4-(trifluoromethoxy)phenyl)-1H-imidazol-4-yl)ethynyl)pyridine) (n = 4 mice for 3 days, red), J20 treated with vehicle (n = 4 mice for 3 days, orange), and J20 treated with CTEP (n = 3 mice for 3 days, green). Nonoverlapping 95% CI bars indicate a significant difference (p < 0.05).

