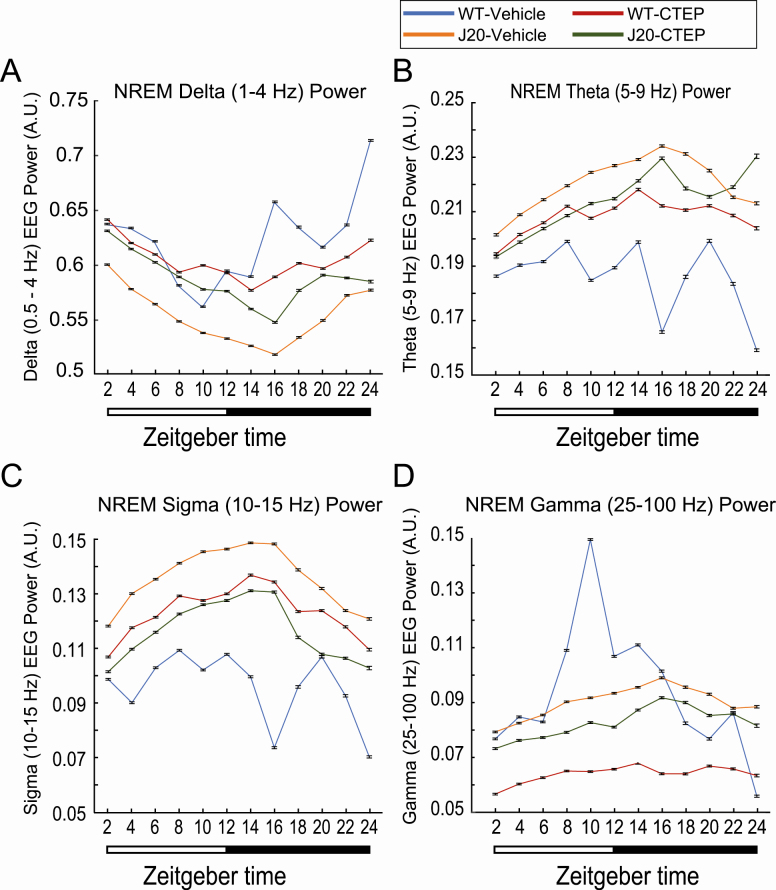
Figure 5.
Power spectra of NREM sleep. Electroencephalographic power spectra of 4-s NREM sleep epochs were determined with a fast-Fourier transform. Resulting power of delta (1–4 Hz), theta (5–9 Hz), sigma (10–15 Hz), and gamma (25–100 Hz) frequencies was isolated and normalized to the summed power of all frequency bands. Each 24-h recording was divided into 2-h segments, and manually scored NREM epochs within each bin were grouped. Here, normalized (A) delta, (B) theta, (C) sigma, and (D) gamma powers are presented as mean ± 95% confidence interval (CI) for each treatment group: wild type (WT) treated with vehicle (n = 3 mice for 3 days, blue); J20 treated with vehicle (n = 4 mice for 3 days, orange); WT treated with CTEP (2-chloro-4-((2,5-dimethyl-1-(4-(trifluoromethoxy)phenyl)-1H-imidazol-4-yl)ethynyl)pyridine) (n = 4 mice for 3 days, red); and J20 treated with CTEP (n = 3 mice for 3 days, green). Nonoverlapping CI bars indicate a significant difference (p < 0.05). Lighting conditions are shown below the graph. Mixed-model ANOVA statistics are provided in Supplementary Table S7.

