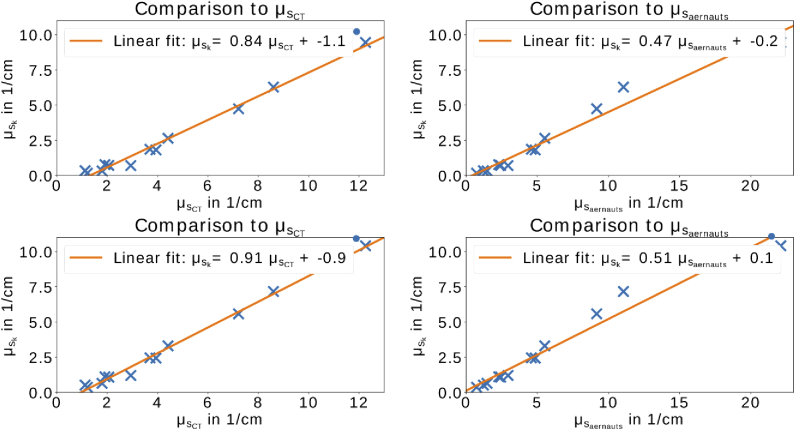
Fig. 5.
Comparison of to (left) and (right). In both graphs, the blue crosses represent the values from over the corresponding scattering coefficient. The lower graphs represents the results with the correction of TT for the used finite cuvette. All fits explain most of the variance (). The value marked by the point is the value for 0.2 % IL concentration at 450 nm which has a too high measured CT and, therefore, a too low scattering coefficient ( and ).

