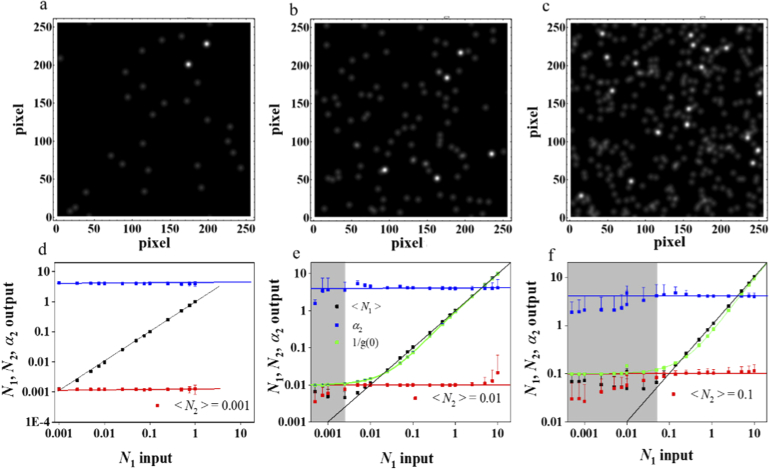
Fig. 1.
Typical examples of simulated DFM images (a, b, and c) of randomly distributed 80 nm AuNPs at different monomer and dimer concentrations. All concentration values are in particles / beam area. (a) DFM image with = 0.02, = 0.001, (b) = 0.1, = 0.01, (c) = 0.5, = 0.1. All three images are 256 × 256 pixels in size with Gaussian focal spots at 5 pixels radius, background noise level of 0.01 of monomer intensity and α2 = 4 ± 0.2. HICS analysis results (d, e, and f) for simulated images at different concentrations. In each plot, we fixed and varied , between 0.001 to 10. (d) HICS analysis for = 0.001, (e) = 0.01, and (f) = 0.1, Input parameters are shown in lines, and extracted data are shown as points. Monomer are black squares, are red squares, α2 are blue squares, and extracted from g1,1(0,0) (i.e., , = 1/g(0) =1/g1,1(0,0)) are shown as the green squares. Each point in the plot is an average from 200 simulated images, and error bars are standard deviation of the 200 simulations. Grey area shows the region where < , in which the accuracy of HICS decreases. In this case, = 1/g1,1(0,0) is a better measure of dominant dimer concentration, as can be seen that green squares match the red line (see text for the details).

