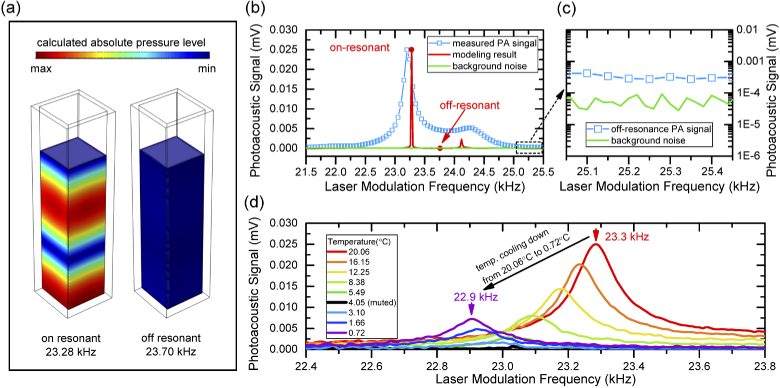
Fig. 2.
(a). Three-dimensional contour maps of acoustic pressure levels in quartz cell units simulated by COMSOL. The rainbow color shows the acoustic pressure levels at on-resonant frequency of 23.28 kHz (left) and at off-resonant frequency of 23.70 kHz (right). (b). Comparison of simulation (red line)/experiment (blue square-line) of photoacoustic spectrum and background noise (green line) within the laser modulation frequency range from 21.5 to 25.5 kHz. (c). Enlarged area of measured photoacoustic spectrum and background noise at the frequency range far away from the resonance peak. (d) Measured temperature dependent photoacoustic spectrums of DI water within temperature range from 20.06 to 0.72 °C. The arrows show the peak frequency measured at 20.06 °C (red) and at 0.72 °C (purple).

