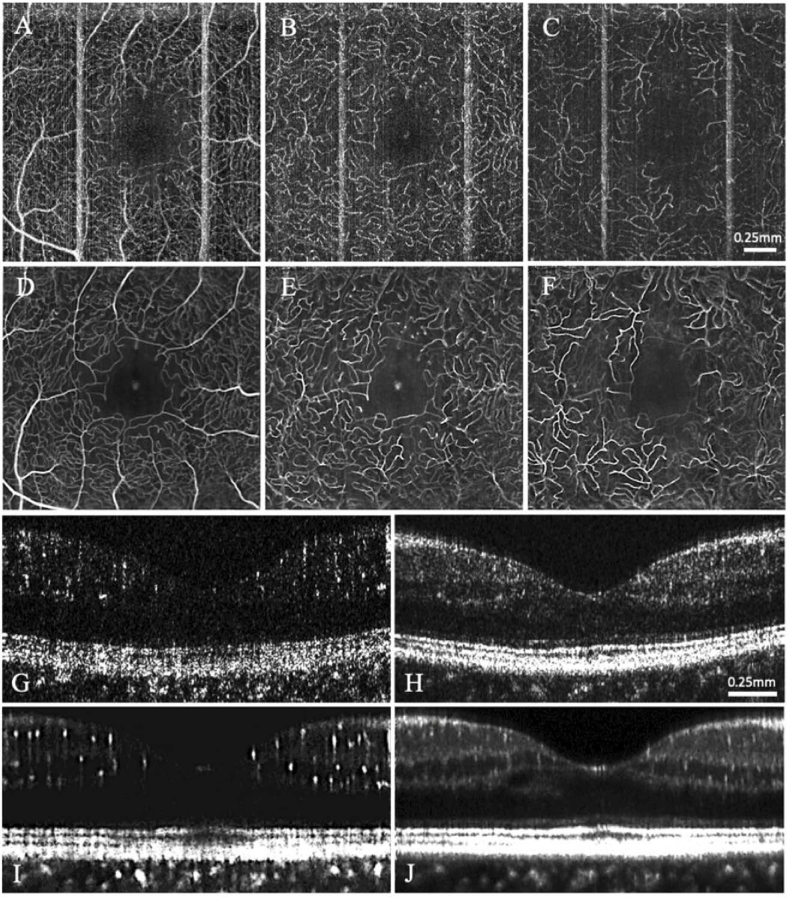
Fig. 4.
Illustration of the impact of serial acquisition and 3D averaging applied to OCT-A data acquired from a patient with moderate non-proliferative diabetic retinopathy. (A, B, C) Single frame OCT-A 2D projections of the superficial, intermediate, and deep vascular plexuses, respectively. (D, E, F) Averaged images of 20 serially acquired and registered volumes of the superficial, intermediate, and deep vascular plexuses, respectively. (G, H) Single angiographic OCT-A and structural OCT B-scans, respectively, extracted from the FAZ region of the same patient. (I, J) 3D-averaged angiographic OCT-A and structural OCT B-scans, respectively.

