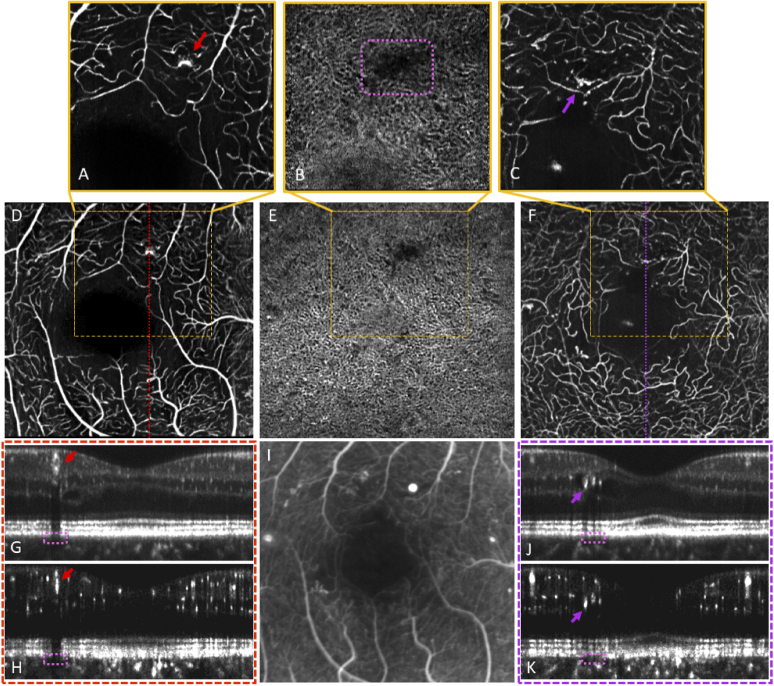
Fig. 7.
Illustration of the algorithm’s ability to extract OCT-A images of the choriocapillaris and correlate with inner retina features. Data acquired from a patient with PDR. (A-C) ∼1 × 1 mm SCP, choriocapillaris, and DVC images, respectively. (D-F) ∼2 × 2 mm SCP, Choriocapillaris, and DVC images, respectively, acquired from a separate imaging session as those in the row above. (G,H) OCT and OCT-A averaged B-scans, respectively, from the location indicated in (D). (I) FA, zoomed and cropped, acquired on the same day as the OCT-A. (J,K) OCT and OCT-A averaged B-scans, respectively, from the location indicated in (F). Red and purple arrows denote two groups of DR disease features localized to their three-dimensional location using averaged en face and orthogonal views. Pink dashed boxes denote regions of apparent signal attenuation in the choriocapillaris layer.

