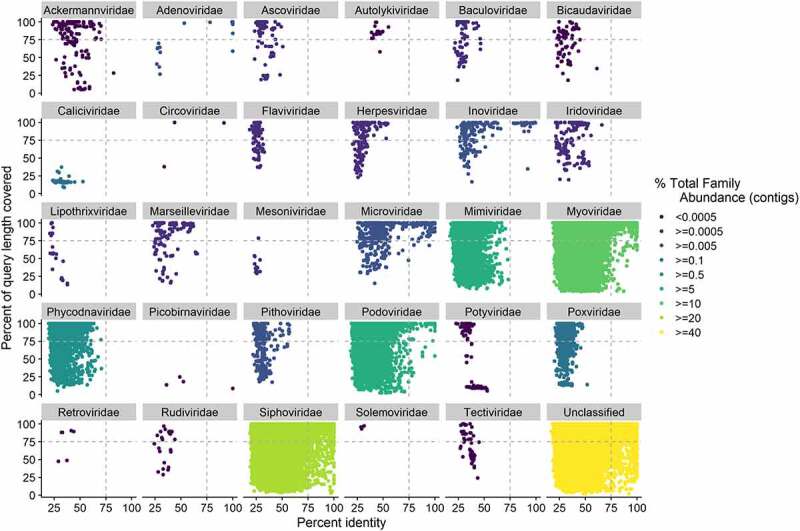
Figure 1.

Confidence in taxonomic classifications, as measured by percentage query coverage and percent identity for protein sequences, predicted from the pooled contigs from IBS (n = 55) and control samples (n = 51), (n = 51,703 contigs). Each protein sequence was taxonomically classified using its top Diamond hit to the viral component of the UniProtKB TrEMBL database. Where the percentage of the query length covered was >100 due to gaps in the alignment, the coverage value was set to a value of 100. Family abundance was calculated by summing the abundance of all contigs assigned to that family and percentage family abundance calculated as the abundance of a family divided by the abundance of all families. Dashed lines indicate 75% identity and query coverage
