. 2021 Feb 22;10:e57417. doi: 10.7554/eLife.57417

Figure 1. IL-2 and IL-4 synergistically promote IL-10 production by Tregs.

(A–C) IL-10 expression of Tregs purified from Foxp3RFP/Il10GFP dual reporter mice (see also Figure 1—figure supplement 1) cultured for 3 days with the designated stimulants as analyzed by flow cytometry. The IL-2/IL-4 condition is twofold the concentration of the single cytokines. For all panels, N ≥ 3 for all bar graphs and histograms are representative. (D) IL-10 production of Tregs cultured with the designated stimulation as quantified by ELISA of the culture supernatants. N = 3. (E) IL-10 expression of purified IL-10+ Tregs cultured with the designated stimulation as quantified by flow cytometry. N = 3. (F) Female and male responses to combinatorial cytokine stimulation after 3 days, as measured by flow cytometry for IL-10 expression. N = 3. (G) FoxP3 expression by purified Tregs stimulated in culture for 3 days with the designated conditions, as analyzed by flow cytometry. N ≥ 27. (H) IL-10 expression of purified Tregs stimulated for 36 hr in culture, washed, and then subsequently stimulated for another 36 hr in culture with the indicated conditions, as analyzed by flow cytometry. All samples received αCD3ε activation (see also Figure 1—figure supplement 2C). N = 3. (I) Cytokine production following 3 days of Treg culture as quantified by multianalyte Luminex of the culture supernatants (see also Figure 1—figure supplement 3). N = 3. (J) IL-2 and IL-4 production by Tregs following 3 days of stimulation with the designated conditions, as quantified by ELISA of the culture supernatants. N = 3. (K) IL-10 production of purified IL-10+ or IL-10- Tregs following 3 days of culture with αCD3ε and combined IL-2/IL-4, as analyzed by flow cytometry (see also Figure 1—figure supplement 4A). N = 3. (L) IL-10 production of purified Tregs cultured with αCD3ε and combined IL-2/IL-4 for 3–7 days as analyzed by flow cytometry (see also Figure 1—figure supplement 4B). Histograms are representative of three independent experiments. Mean ± SEM are indicated. *p<0.05, **p<0.01, ***p<0.001, ****p<0.0001.

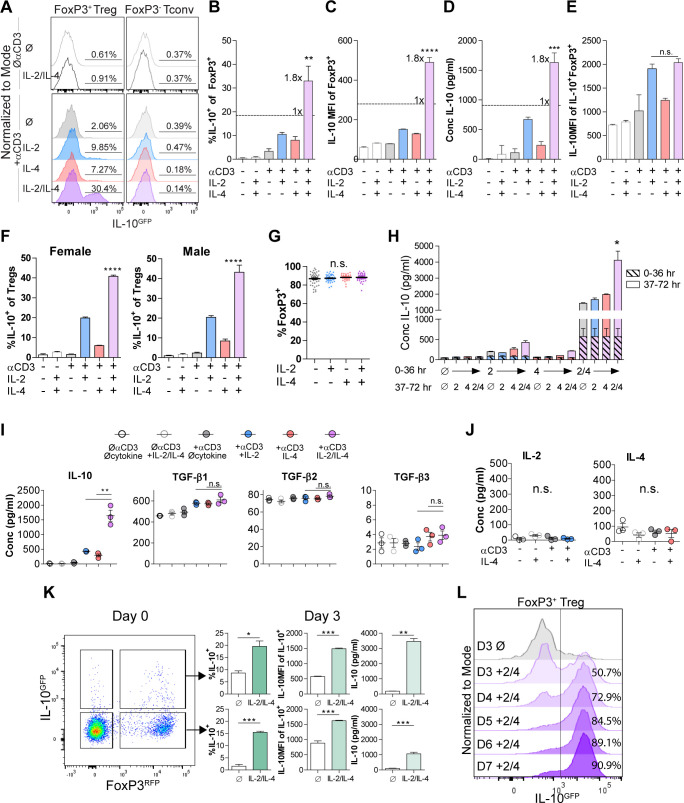
Figure 1.

Figure 1—figure supplement 1. Cell sorting gating strategy and post-sort purity.

Figure 1—figure supplement 1.

(A) Gating strategy for flow cytometry sorting and analyzing IL-10+/- Tregs from Foxp3RFP/Il10GFP dual-reporter mice. Freshly harvested spleens underwent CD4+ magnetic bead selection prior to fluorescence-activated cell sorting. Related to Figure 1. (B) Sorted cells were immediately analyzed by flow cytometry to determine purity. Related to Figure 1.
Figure 1—figure supplement 2. Dosing and time-dependency of combinatorial cytokine stimulation in Tregs.

Figure 1—figure supplement 2.

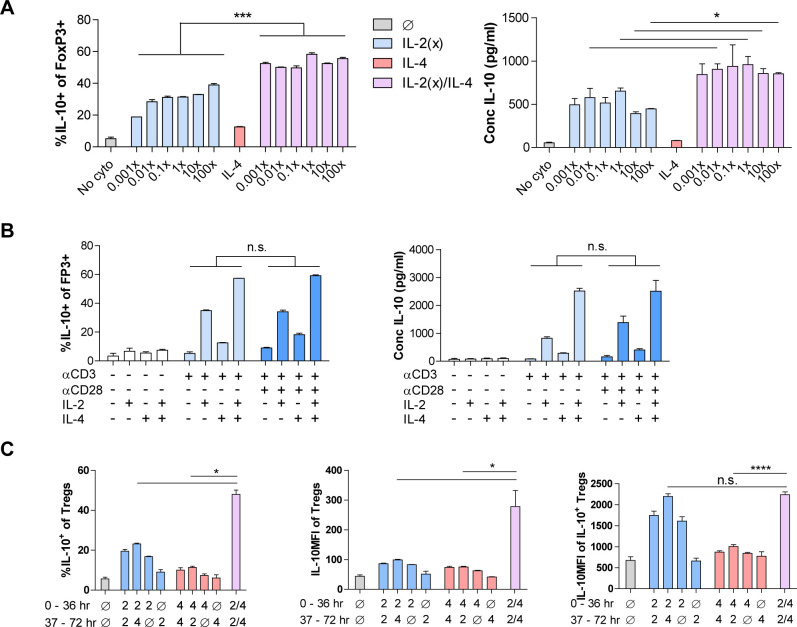
(A) IL-10 expression and production by purified Tregs stimulated for 3 days with the indicated cytokines while titrating IL-2 and analyzed by flow cytometry and ELISA, respectively. 1× IL-2 = 728 pM. (B) IL-10 expression and production by purified Tregs stimulated for 3 days with the indicated T cell receptor activation, co-stim, and cytokine conditions, analyzed by flow cytometry and ELISA, respectively. (C) IL-10 expression of purified Tregs stimulated for 36 hr in culture with the first set of conditions, washed, and subsequently stimulated for another 36 hr in culture with the second set of conditions, as analyzed by flow cytometry. All samples received αCD3ε activation. N = 3. Related to Figure 1H. For all panels, mean ± SEM are indicated. *p<0.05, **p<0.01, ***p<0.001, ****p<0.0001.
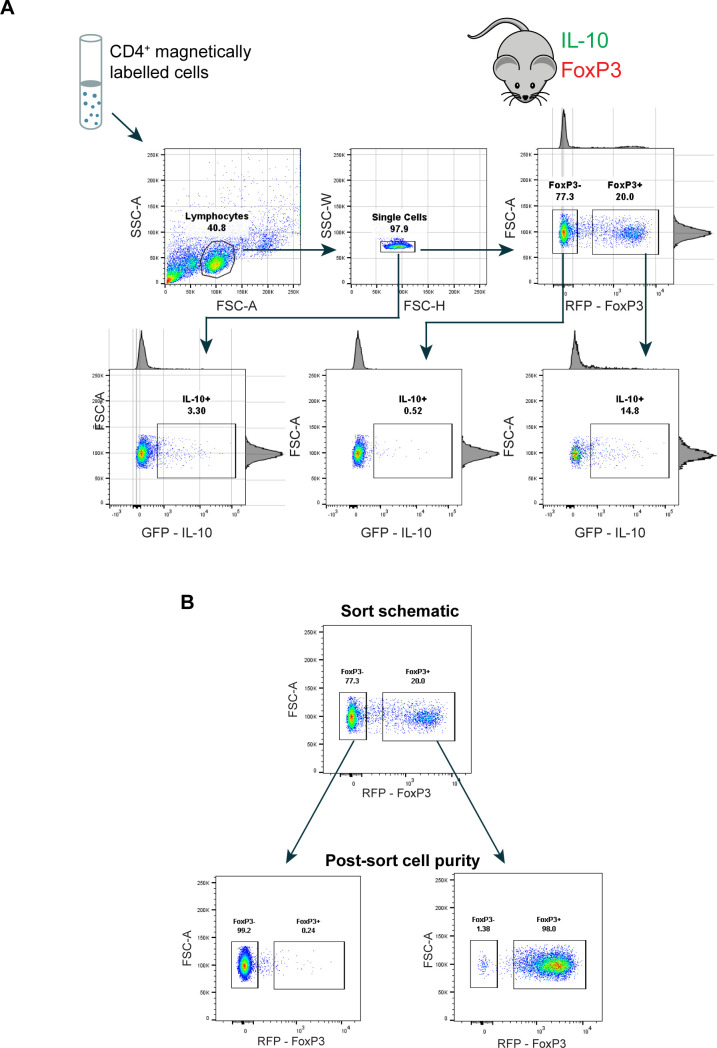
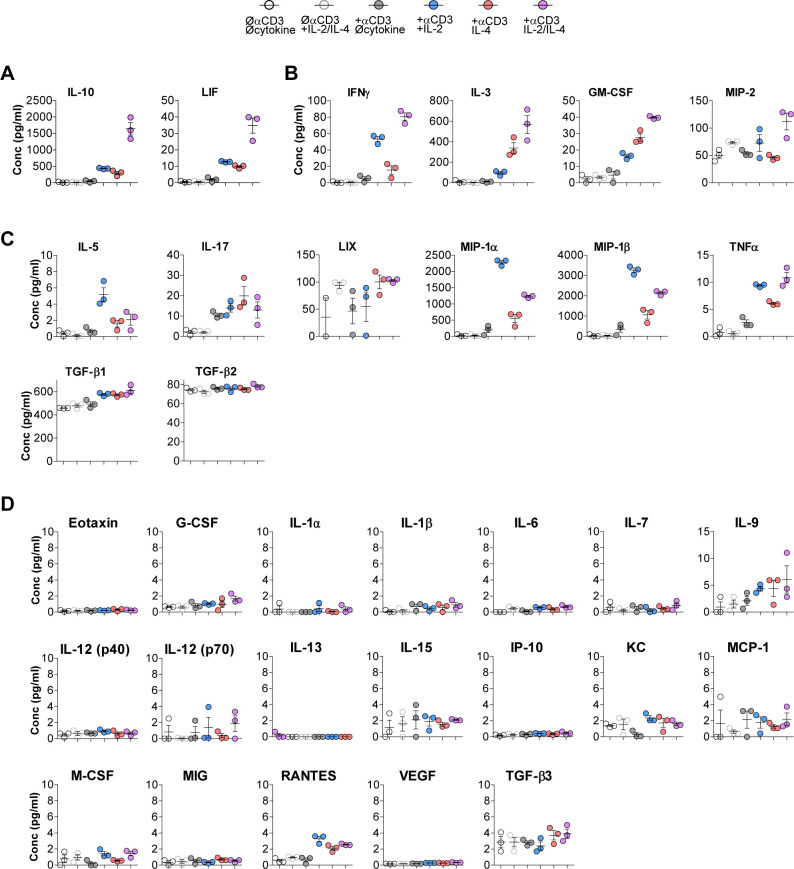
Figure 1—figure supplement 3. IL-10 is the only synergistic and robust analyte produced by Tregs following combinatorial cytokine stimulation 31-plex.

Figure 1—figure supplement 3.

Luminex analysis of cytokines secreted into the media following the designated stimulation conditions grouped in cytokines that (A) synergistically increase with combinatorial cytokine stimulation, (B) are summative, (C) show no change compared to single cytokine stimulation, and (D) are not highly expressed. Related to Figure 1I and J. N = 3. For all panels, mean ± SEM are indicated.
Figure 1—figure supplement 4. Dynamics of combinatorial cytokine stimulation of Tregs over time.

Figure 1—figure supplement 4.

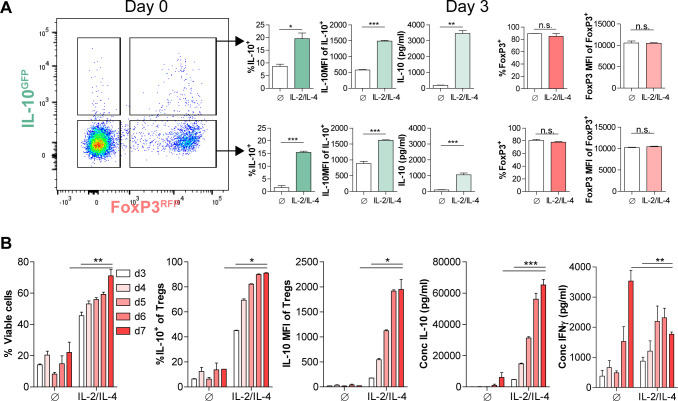
(A) IL-10 and FoxP3 expression of purified IL-10+/- Tregs that underwent culture with αCD3ε and combined IL-2/IL-4for 3 days, as analyzed by flow cytometry. N = 3. Related to Figure 1K. (B) Analysis of viability and IL-10 expression of purified Tregs cultured with αCD3ε and combined IL-2/IL-4 for 3–7 days, as analyzed by flow cytometry. IL-10 and IFNγ contents in the culture media were analyzed by ELISA. Related to Figure 1L. For all panels, mean ± SEM are indicated. *p<0.05, **p<0.01, ***p<0.001, ****p<0.0001.