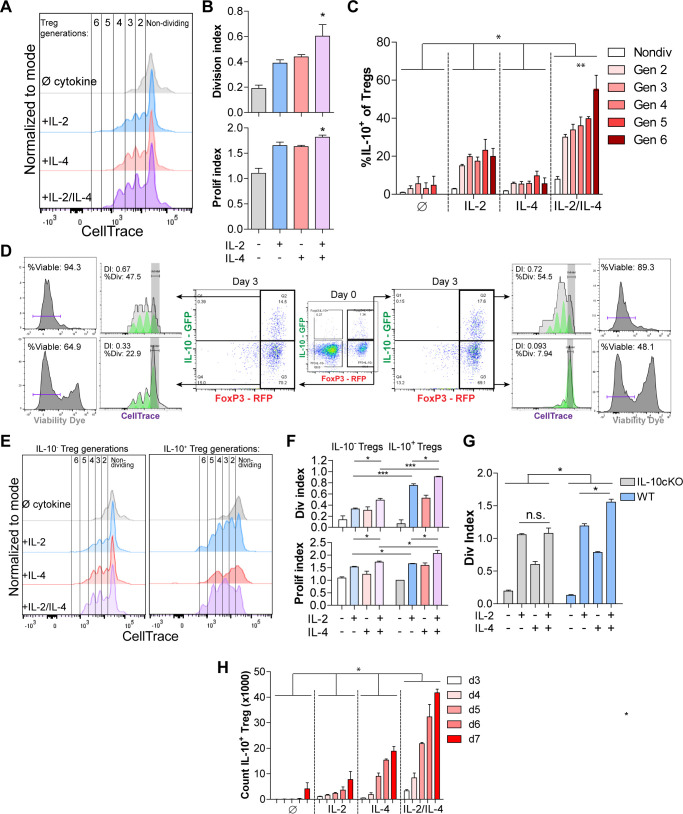
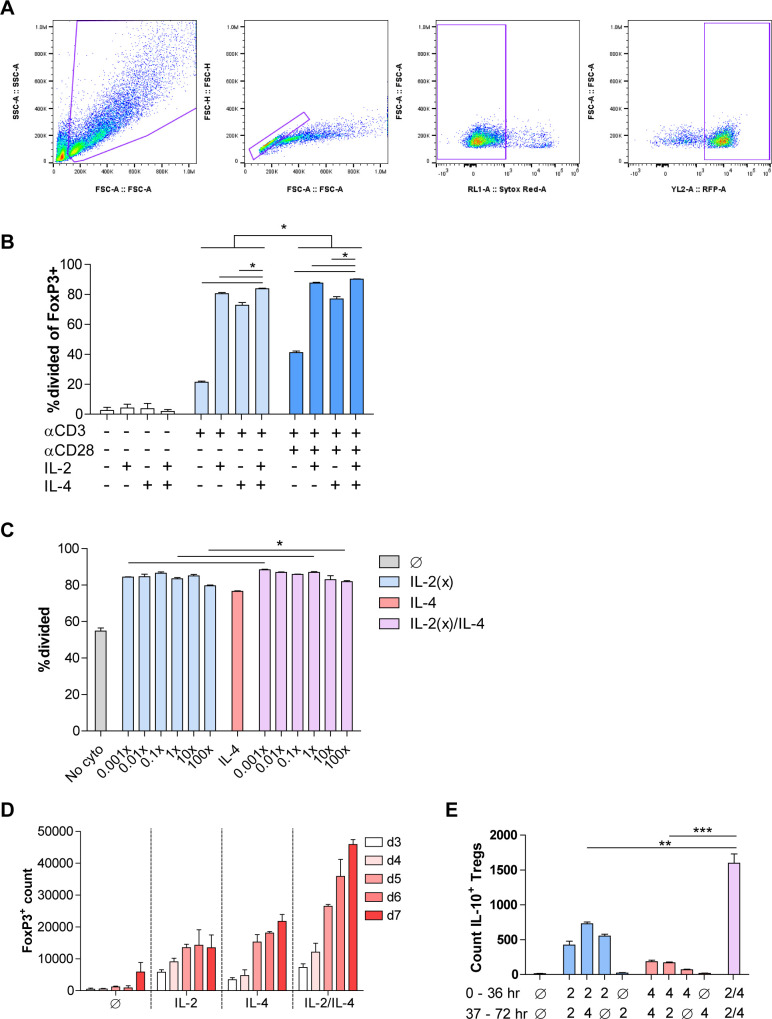
Figure 2. IL-2/IL-4 enhances Treg proliferation and selectively drives the expansion of IL-10+ Tregs.
(A and B) Treg proliferation as measured by CellTrace signal following 3 days of culture with αCD3ε and all combinations of IL-2 and IL-4, with division and proliferation indices indicated. N = 3 for all bar graphs and histograms are representative. (C) IL-10 expression of purified Tregs cultured for 3 days with αCD3ε and the designated cytokines, and gated by CellTrace generation, as measured by flow cytometry (panel A). N = 3. The IL-10 expression of all IL-2/IL-4-induced Treg generations are statistically significant (p<0.05) compared to the other cytokine-stimulated conditions. (D) Proliferation and viability of purified IL-10+ and IL-10- Tregs cultured for 3 days with αCD3ε and both IL-2 and IL-4, as flow cytometry analysis of CellTrace and Sytox Red signal. The histograms are representative. N = 3. (E and F) Proliferation of purified Tregs cultured for 3 days with αCD3ε and all cytokine combinations, gated on IL-10+/- expression, as analyzed by flow cytometry. N = 3 for all bar graphs and histograms are representative. (G) Division index of wild type (FoxP3creYFP) and IL-10 cKO (IL-10fl/fl× FoxP3creYFP) purified Tregs that were stimulated with the indicated conditions for 3 days, as analyzed by flow cytometry. N = 3 for all bars. (H) Cell count of IL-10+ Tregs following 3–7 days of culture with αCD3ε and all combinations of IL-2 and IL-4, as analyzed by flow cytometry. N = 3. The cell counts of all IL-2/IL-4-induced conditions are statistically significant (p<0.05) compared to the other cytokine-stimulated conditions. For all panels, mean ± SEM are indicated. *p<0.05, **p<0.01, ***p<0.001.


