. 2021 Feb 22;10:e57417. doi: 10.7554/eLife.57417

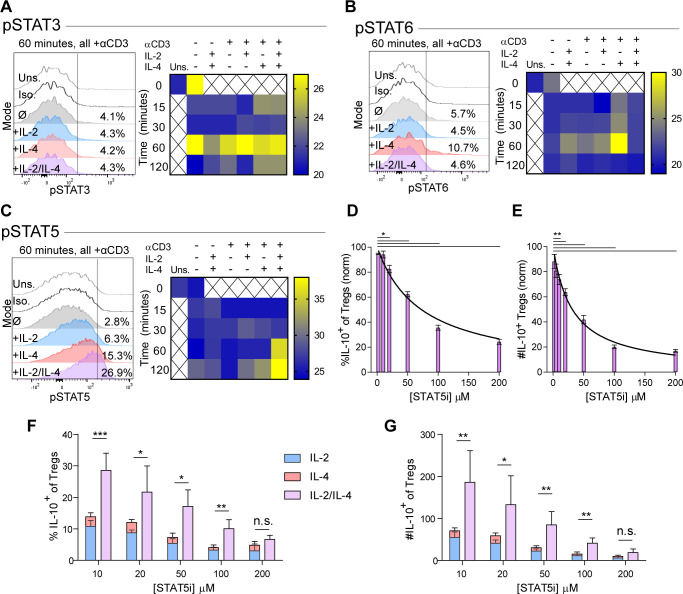
Figure 4. Synergistic IL-10 production and proliferation is STAT5-dependent.

(A–C) pSTAT3, pSTAT6, and pSTAT5 expression of purified Tregs stimulated with the indicated culture conditions as analyzed by flow cytometry. The histograms are representative and heatmaps of median fluorescence intensity (MFI) represent N ≥ 3 experiments. (D and E) Treg expression of IL-10 and enumeration of IL-10+ Tregs following αCD3ε, combined IL-2/IL-4, and STAT5i supplementation in 3-day culture, as analyzed by flow cytometry (see also Figure 4—figure supplement 1). N = 3. (F and G) IL-10 expression in Tregs and IL-10+ Tregs counts following αCD3ε, all combinations of IL-2 and IL-4, and STAT5i supplementation in 3-day culture, as analyzed by flow cytometry. N = 3. For all panels, mean ± SEM are indicated. *p<0.05, **p<0.01, ***p<0.001.

Figure 4.

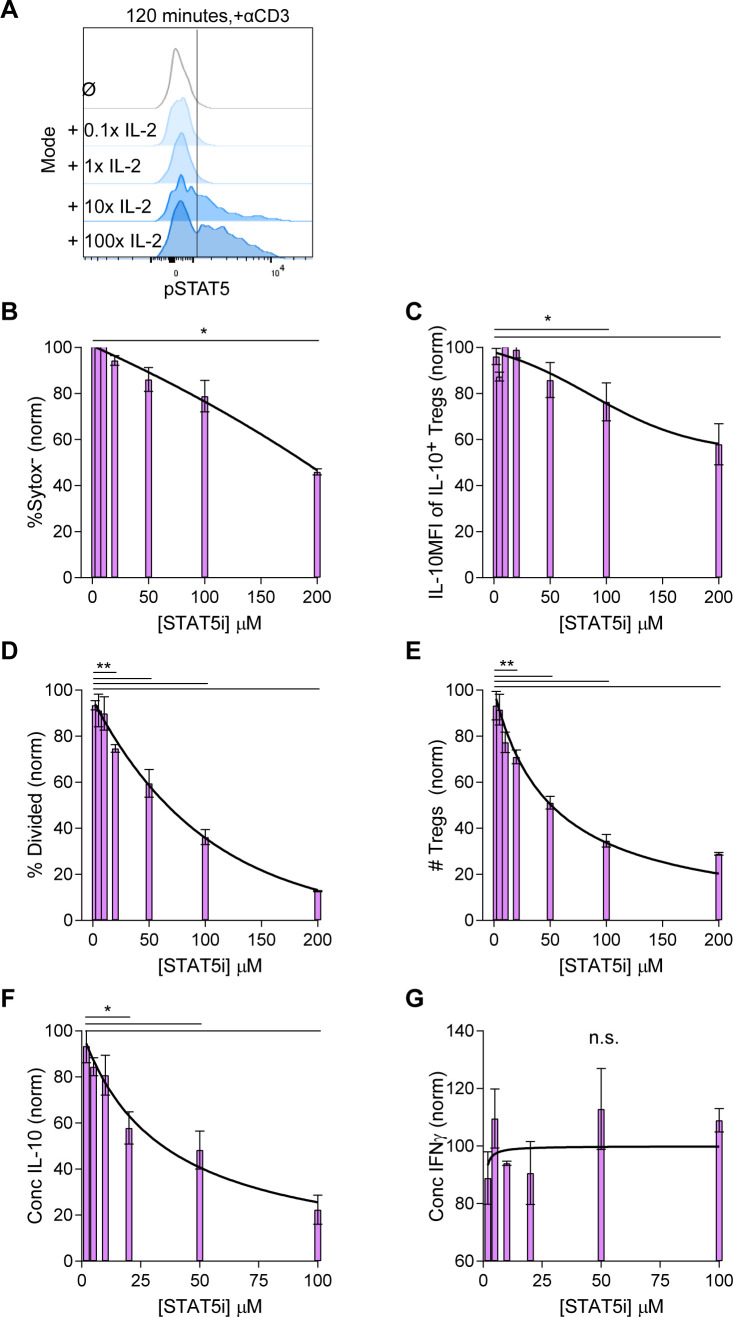
Figure 4—figure supplement 1. The IL-10 and proliferative response following combined IL-2 and IL-4 stimulation is dependent on STAT5 signaling.

Figure 4—figure supplement 1.

(A) pSTAT5 expression following IL-2 stimulation at the indicated concentrations, with 1× = 728 pM, and as analyzed by flow cytometry. (B–E) Analysis of viability (Sytox Red), IL-10 expression, and proliferation of purified Tregs that were cultured with αCD3ε, combined IL-2 and IL-4, and STAT5i (resuspended in DMSO) in the indicated concentrations for 3 days, as analyzed by flow cytometry. The values are normalized to Tregs cultured with the same stimulation conditions but with DMSO only and no STAT5i. (F and G) Quantification of IL-10 and IFNγ secreted by the cells in the culture setup above as analyzed by ELISA. N = 3. Related to Figure 4. For all panels, mean ± SEM are indicated. *p<0.05, **p<0.01.