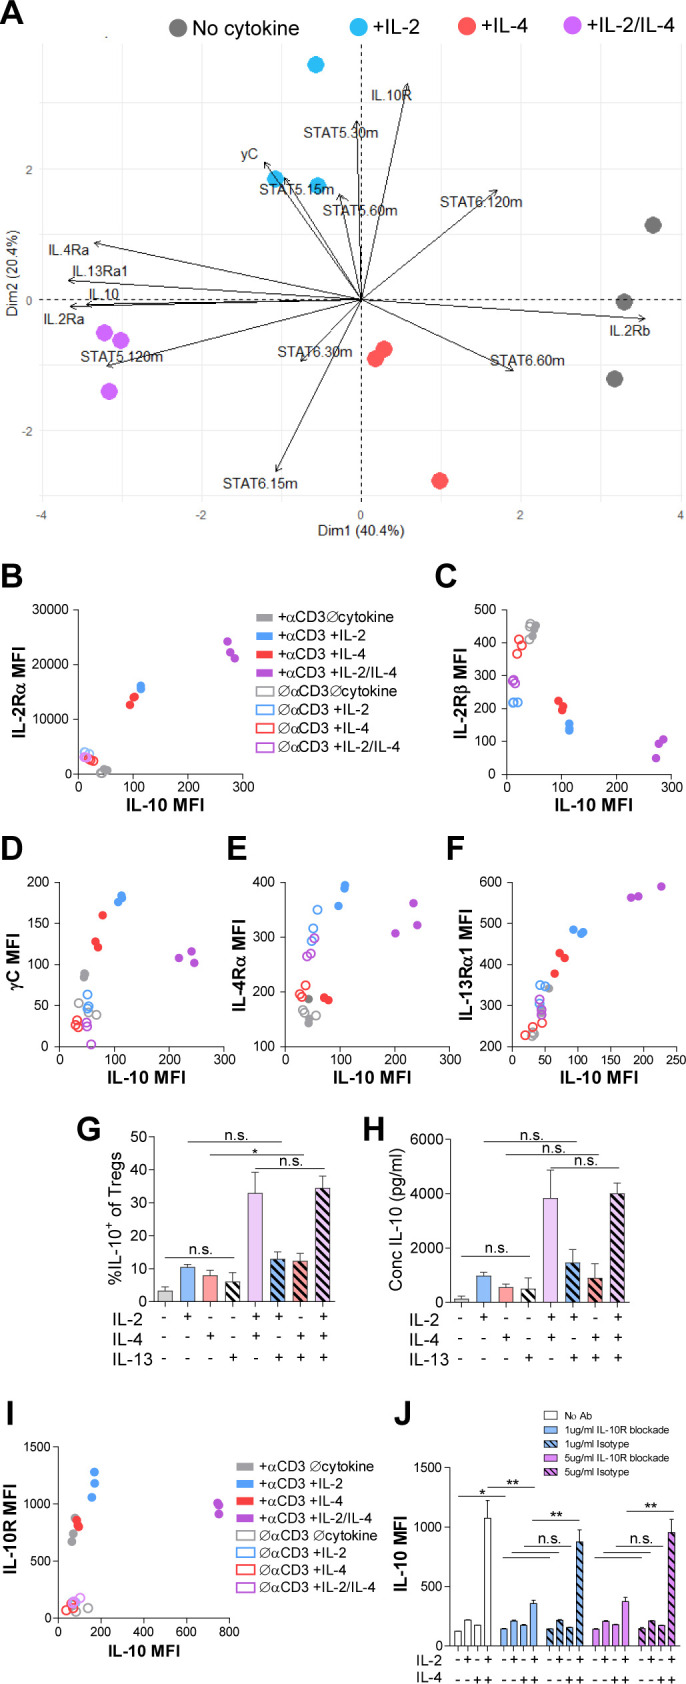
Figure 5. Combinatorial IL-2 and IL-4 signaling promotes the expression of the Type 2 IL-4 receptor.
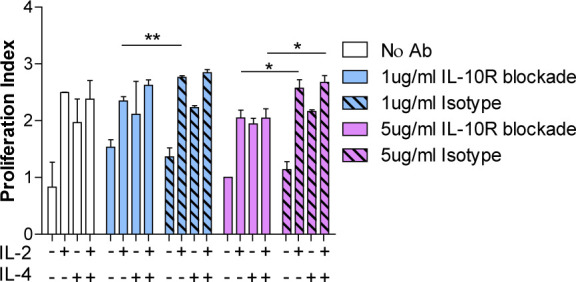
(A) Expression of 14 parameters as shown in an unpaired principle component analysis of Tregs purified and stimulated with αCD3ε and all cytokine conditions for 3 days unless otherwise noted in the vectors. N = 3. (B–F) Surface expression of receptor subunits that comprise the multiple forms of the IL-2R and IL-4 on purified Tregs from Foxp3RFP/Il10GFP dual reporter mice that were stimulated for 3 days with or without αCD3ε and with all cytokine combinations. Expression of receptor subunits is plotted as a function of IL-10 expression. N = 3. (G and H) Quantification of IL-10 expression and protein concentration secreted by Tregs that were purified and cultured for 3 days with αCD3ε and all combinations of IL-2, IL-4, and IL-13, as analyzed by flow cytometry and ELISA, respectively. N = 3. (I) Surface expression of IL-10R on purified Tregs from Foxp3RFP/Il10GFP dual reporter mice that were stimulated for 3 days with or without αCD3ε and with all cytokine combinations. Expression of receptor subunits is plotted as a function of IL-10 expression. N = 3. (J) IL-10 expression of purified Tregs stimulated with αCD3ε and all cytokine conditions for 3 days with or without neutralizing IL-10R monoclonal antibody or isotype control blockade, as analyzed by flow cytometry (see also Figure 5—figure supplement 1). N = 3. For all panels, mean ± SEM are indicated. *p<0.05.

Figure 5—figure supplement 1. IL-10R blockade modestly reduces IL-2/IL-4-induced Treg proliferation.

