Figure 7. Combined IL-2 and IL-4 reduces the severity of experimental autoimmune encephalomyelitis (EAE).
(A and B) EAE clinical score and FFPE-processed spinal cords sectioned and stained with H and E and LFB from mice challenged with myelin oligodendrocyte glycoprotein (MOG) peptide with and without combined IL-2/IL-4 and subclinically effective doses of the individual cytokines (For statistical analyses, see Figure 7—figure supplement 1). Histological images of H and E and Luxol Fast Blue (LFB) staining represent a mouse of the mean disease score of each condition. N = 10–12 for EAE mice; N = 4 for vehicle control mice. (C) EAE clinical score and FFPE-processed spinal cords sectioned and stained with H and E and LFB from mice challenged with MOG peptide with and without the combined cytokines according to the indicated dosing schedule (for statistical analyses, see Figure 7—figure supplement 2A and B). N = 10–12 for EAE mice; N = 4 for vehicle control mice. (D) Analysis of MOG-loaded MHCII tetramer positive Tconv cells in the CNS as determined by flow cytometry. The color legend is indicated for panels D–H. N = 3 (E) Quantification of IL-17A secreted by CNS leukocytes isolated by Percoll gradient and incubated overnight in media, as quantified by ELISA. The conditions are described by the key in 7C. N = 3. (F and G) Analysis of Treg abundance and IL-10-expression in Tregs isolated from the CNS or spleen of Foxp3RFP/Il10GFP mice in the EAE trials by flow cytometry. The conditions are described by the key in 7C. N = 3. (H) Analysis of IL-10 expression of F4/80+ CNS macrophages from Foxp3RFP/Il10GFP mice in the EAE trials by flow cytometry. The conditions are described by the key in 7C. N = 3. (I and J) Assessment of EAE severity in IL-10 cKO mice quantified by daily clinical scoring (For statistical analyses, see Figure 7—figure supplement 3B) and FFPE-processing of spinal cords stained with H and E and LFB. Images represent a mouse of the mean disease score of each condition. N = 10–12 for EAE mice; N = 4 for negative control mice for disease. N = 10–12 for EAE mice; N = 4 for vehicle control mice. (K) Assessment of EAE severity in Il10-/- mice as quantified by daily clinical scoring. N = 7–8 for EAE mice; N = 4 for negative control mice for disease (see also Figure 7—figure supplement 3C). (L) Quantification of IL-17A secreted by CNS leukocytes of Il10-/- mice isolated by Percoll gradient and incubated overnight in media, as quantified by ELISA. N = 3. For all panels, mean ± SEM are indicated. *p<0.05, **p<0.01, ****p<0.0001.

Figure 7—figure supplement 1. Combined IL-2 and IL-4 suppressed the severity of experimental autoimmune encephalomyelitis (EAE).

Figure 7—figure supplement 2. Combined IL-2 and IL-4 suppressed the severity of experimental autoimmune encephalomyelitis (EAE) in preventative, concomitant, and therapeutic dosing regiment.

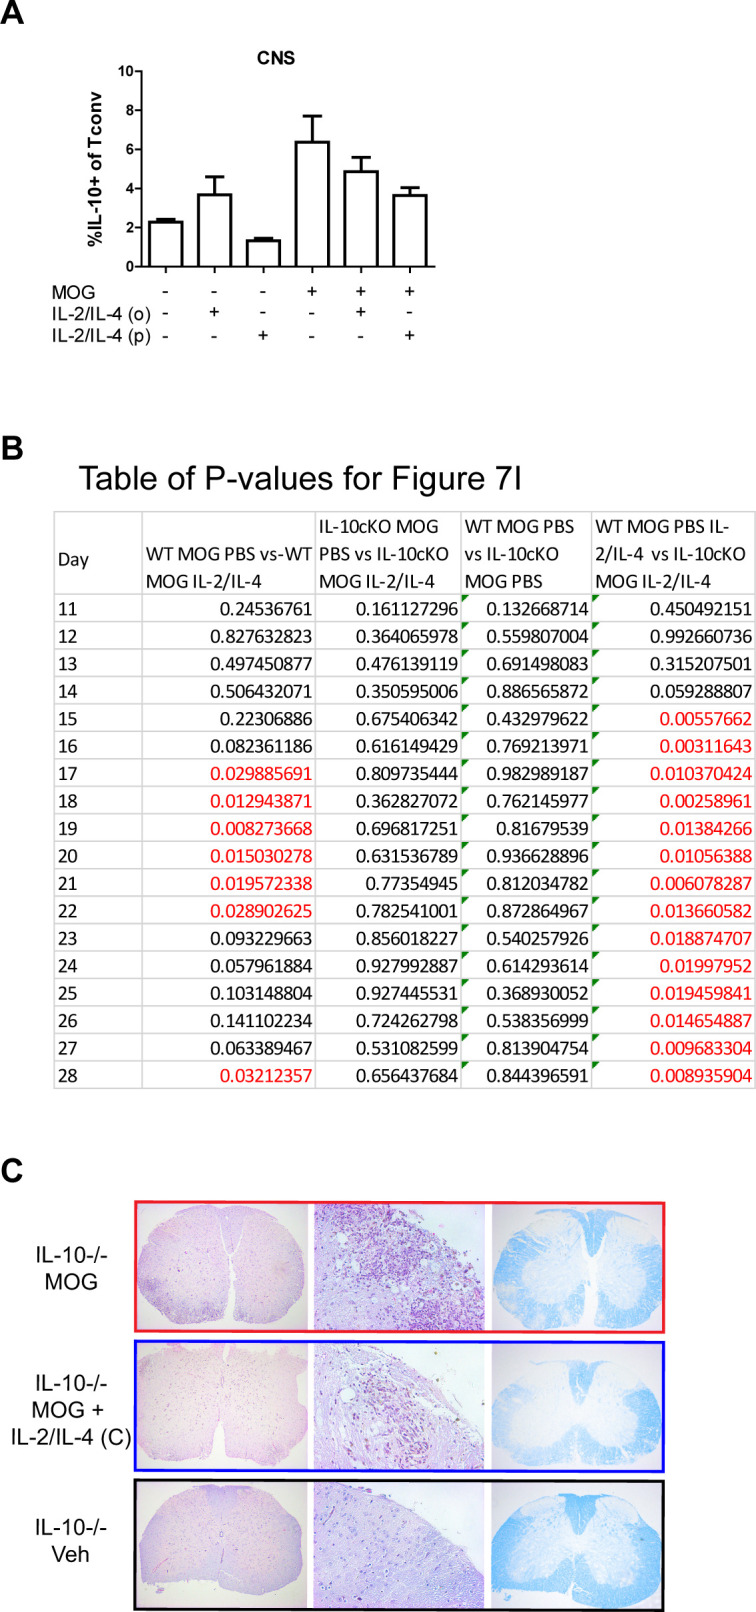
Figure 7—figure supplement 3. IL-10 is critical for suppression of experimental autoimmune encephalomyelitis (EAE) by IL-2/IL-4.