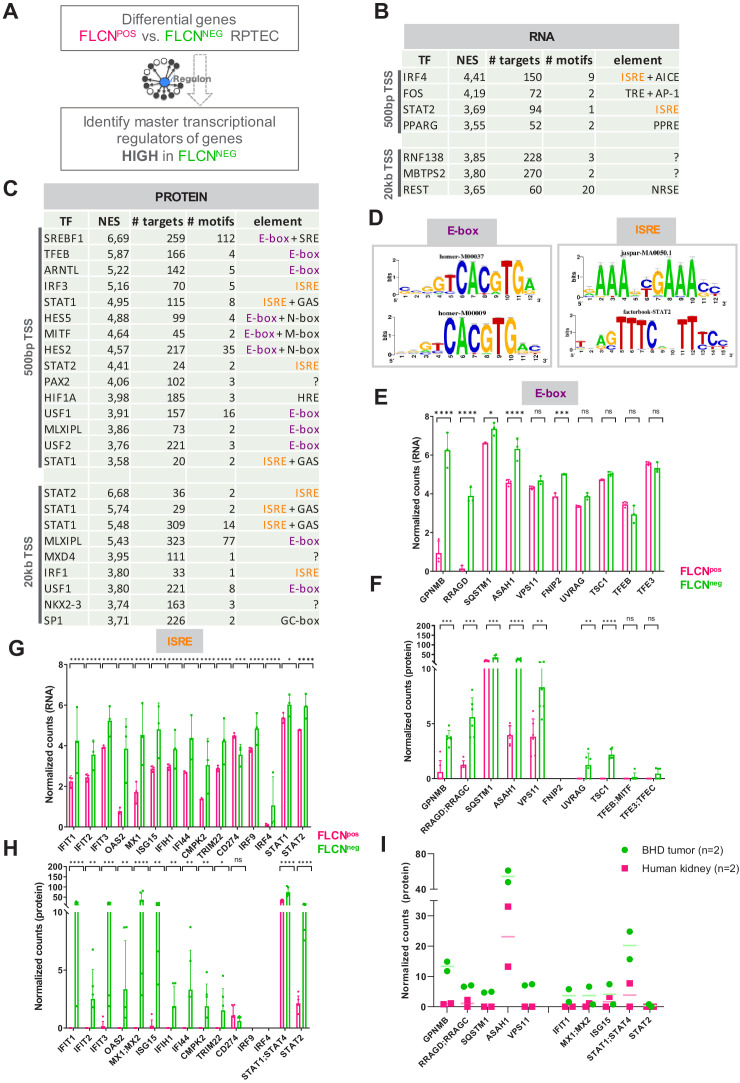
Figure 6. Identification of regulatory elements activated by FLCN loss in RPTEC and BHD tumors.
(A) Identification of transcriptional regulatory elements associated with loss of FLCN expression. Regulons were identified by iRegulon (Janky et al., 2014), using an input a list of differential expressed genes (Figure 3). (B) Upstream regulons enriched in FLCNNEG RPTEC based on significantly upregulated genes derived from our transcriptomic data set (n = 711, FDR < 0.05 and logFC > 2). Transcription factors with normalized enrichment scores (NES) higher than 3.5 are shown, together with detected number of targets, motifs, and elements. ISREs are highlighted in orange. Upper part shows motifs enriched 500 bp upstream from transcription start site (TSS), lower part shows motifs enriched 20 kb around TSS. (C) Upstream regulons enriched in FLCNNEG RPTEC based on significantly upregulated proteins derived from our proteomic data set (n = 498, p<0.05 and FC > 2). Transcription factors with normalized enrichment score (NES) higher than 3.5 are shown, together with number of targets, motifs, and elements detected. ISREs are highlighted in orange and E-boxes in purple. STAT1 appears twice due to the fact that iRegulon ranks this transcription factor to be the most likely upstream regulator for two sets of targets genes, containing slightly different ISRE-motifs 20 kb upstream from the TSS. (D) Two major enriched motif elements detected in iRegulon analysis of genes upregulated in FLCNNEG RPTEC. Regulons can be assigned to E-box (in purple) or ISRE (in orange) motif group. (E) Bar graphs of RNA expression levels of genes associated with an E-box motif, derived from RPTEC transcriptomic data set. FLCNPOS values are shown in pink and FLCNNEG values are shown in green. Significant p-values are indicated as *≤0.05, **≤0.01, ***≤0.001, ****≤0.0001. (F) Bar graphs of protein expression levels of genes associated with an E-box motif, derived from RPTEC proteomic data set. FLCNPOS values are shown in pink and FLCNNEG values are shown in green. FNIP2 peptides were not detected in our proteomic experiment and therefore absent in the bar graph. Significant p-values are indicated as *≤0.05, **≤0.01, ***≤0.001, ****≤0.0001. (G) Bar graphs of RNA expression levels of genes associated with an ISRE motif derived from RPTEC transcriptomic data set. FLCNPOS values are shown in pink and FLCNNEG values are shown in green. Significant p-values are indicated as *≤0.05, **≤0.01, ***≤0.001, ****≤0.0001. (H) Bar graphs of protein expression levels of genes associated with an ISRE motif derived from RPTEC proteomic data set. FLCNPOS values are shown in pink and FLCNNEG values are shown in green. IRF9 and IRF4 peptides were not detected in our proteomic experiment and therefore absent in the bar graph. Significant p-values are indicated as *≤0.05, **≤0.01, ***≤0.001, ****≤0.0001. (I) Dot plot of protein expression levels of genes associated with an E-box (left) or ISRE motif (right) derived from BHD kidney tumor proteomic data sets (see Figure 6—figure supplement 1D and E), as compared to normal kidney tissue. FLCNPOS values are shown in pink and FLCNNEG values are shown in green. STAT2 levels were below detection levels in these protein extracts.


