. 2020 Dec 15;9:e60812. doi: 10.7554/eLife.60812

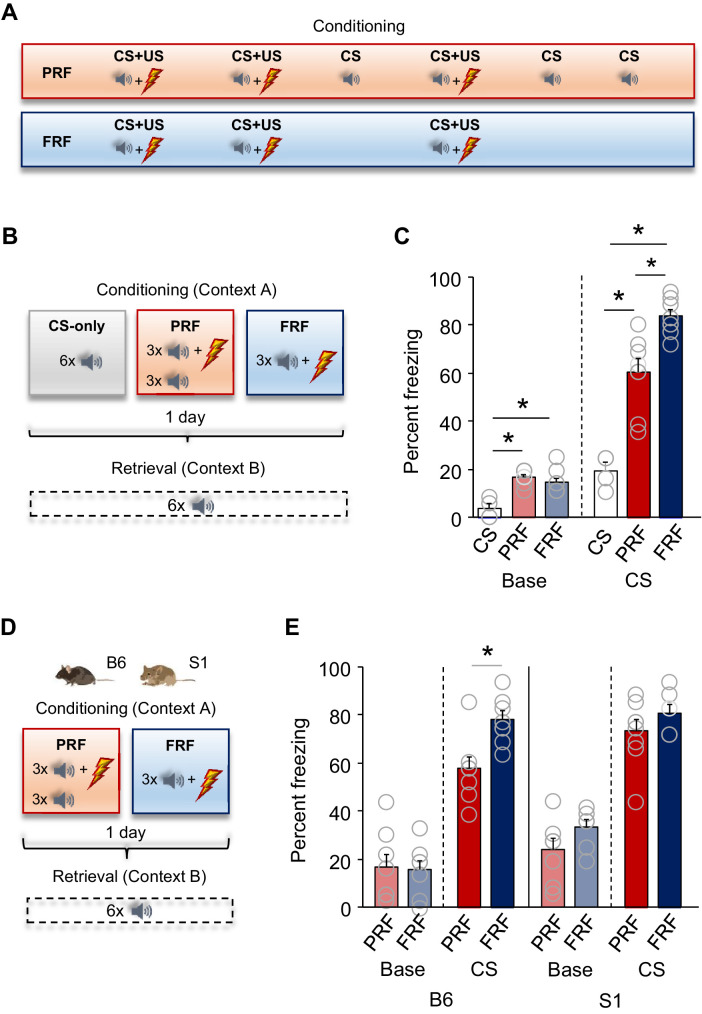
Figure 1. Lower freezing during retrieval of partially reinforced fear; effects of genetic strain.

(A) Schematic depiction of experimental procedure for assessing, in B6 mice, PRF and FRF, along with CS-only controls. (B) Schematic depiction of experimental procedure for assessing, in B6 mice, PRF and FRF retrieval in a novel context (context B) and the conditioning context (context A) (C) Lower CS-related freezing during retrieval in PRF mice than in FRF mice. Higher baseline and CS-related freezing in PRF and FRF mice relative to CS-only controls (n = 4–8 mice per group). (D) Schematic depiction of experimental procedure for assessing PRF and FRF retrieval in the B6 and S1 genetic strains. (E) Lower CS-related freezing during retrieval in PRF than in FRF in B6, not S1, mice (n = 7–8 mice per group/strain). Data are means ± SEM. *p<0.05.

Figure 1—source data 1. PRF versus FRF (Figure 1C).
Figure 1—source data 2. Strain comparison (Figure 1E).

Figure 1.

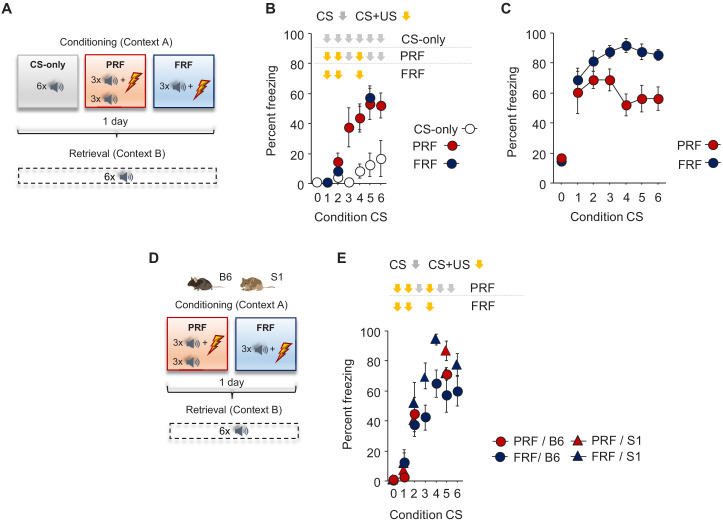
Figure 1—figure supplement 1. Freezing during conditioning.

Figure 1—figure supplement 1.

(A) Schematic depiction of experimental procedure for assessing, in B6 mice, PRF and FRF, along with CS-only controls. (B) No group differences in CS-related freezing during conditioning (n = 4–8 mice per group). (C) No difference in CS-related freezing between FRF and PRF mice during retrieval, broken down by CS presentation (n = 8 mice per group). (D) Schematic depiction of experimental procedure for assessing PRF and FRF retrieval in the B6 and S1 genetic strains. (E) No group differences in CS-related freezing during conditioning (n = 7–8 mice per group/strain). Data are means ± SEM.
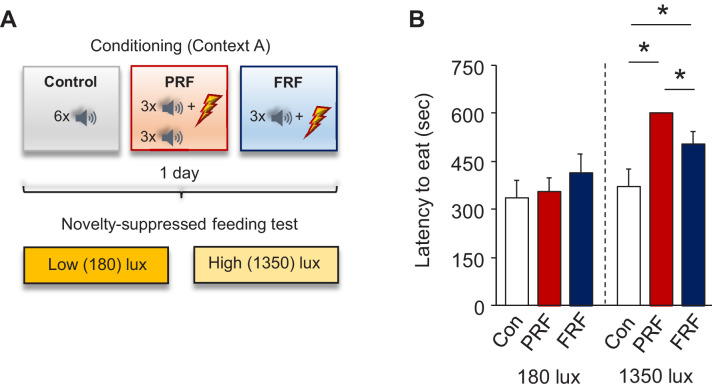
Figure 1—figure supplement 2. Increased latency to feed in the NSF test after PRF.

Figure 1—figure supplement 2.

(A) Schematic depiction of experimental procedure for assessing behavior on the novelty-suppressed feeding (NSF) test after PRF or FRF conditioning, along with context-exposed controls. (B) Longer latencies to eat under high, but not low, illumination in PRF and FRF versus controls and in PRF versus FRF. n = 8 mice per group. Data are means ± SEM. *p<0.05.