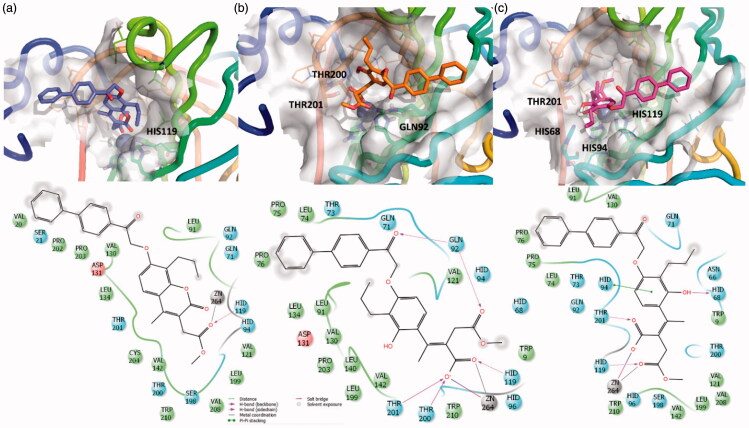
Figure 3.
3D representation of the putative binding mode obtained by docking experiments. (a) hCA-IX – EMAC10157g, (b) hCA-IX – EMAC10157g-openE, and (c) hCA-IX – EMAC10157g-openZ and the relative 2D representation of the complexes stabilising interactions with the binding site residues represented with different colour depending on their chemical-physical properties: green, hydrophobic; cyan, polar; violet, positive; red, negative charged residues; grey, metal atoms. Instead, magenta arrows indicate the formation of a hydrogen bond between protein and ligand, while grey lines indicate the interaction with the complexed ion.

