
Figure 3.
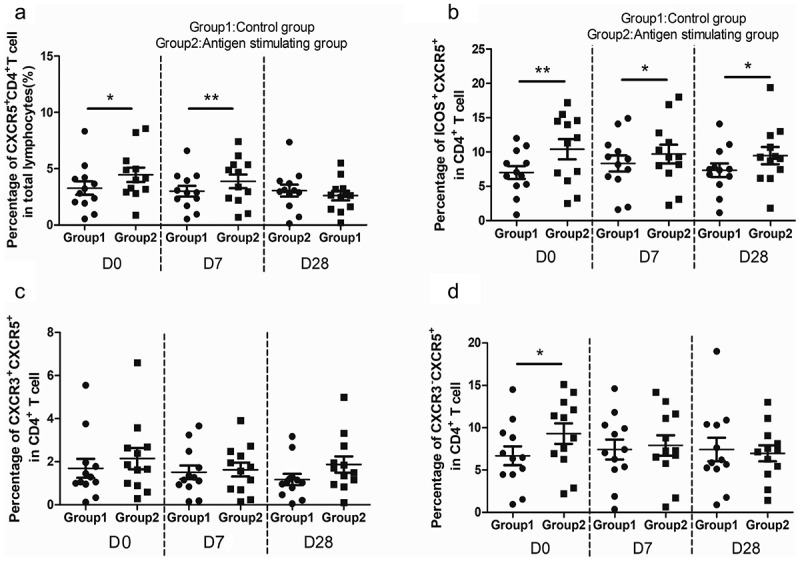
Tfh cells subsets expression after HBsAg stimulation of PBMCs from young adults in vitro. (A-D)
Comparison between frequencies of CXCR5+CD4+T cell, ICOS+CXCR5+CD4+T cell CXCR3+CXCR5+CD4+T cell CXCR3−CXCR5+CD4+T cell from HBsAg-stimulated PBMC or control at D0, D7, and D28 (n = 12)